
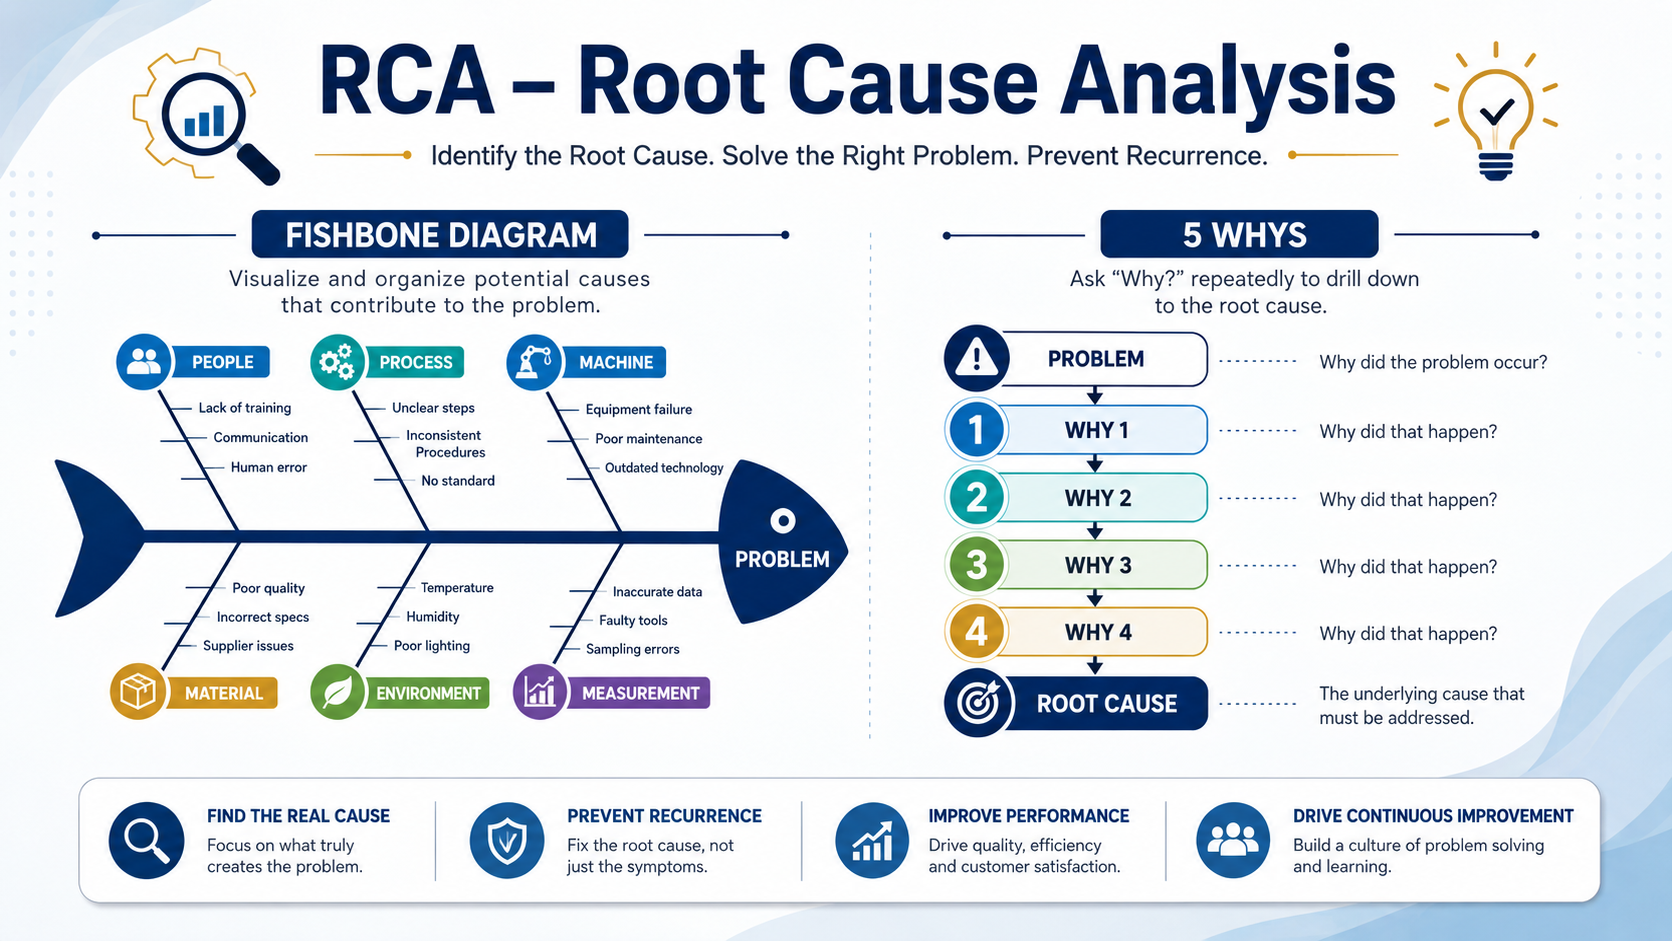
Root Cause Analysis:
Fishbone Diagram & 5 Whys
A practitioner's authority guide to eliminating problems permanently — not just suppressing their symptoms.
What Is Root Cause Analysis?
Root Cause Analysis (RCA) is a structured investigative methodology used to identify the fundamental source of a problem — the underlying condition that, if corrected, prevents the problem from recurring. It is the cornerstone of continuous improvement programmes such as Lean, Six Sigma, ISO 9001, and Total Quality Management (TQM).
Most organisations react to failures by addressing their visible symptoms: a machine breakdown is repaired, a defective batch is scrapped, a customer complaint is apologised for. RCA forces a harder question: why did this happen at all?
"Every defect is a treasure — if you resolve it permanently by finding its root cause, you have made the process stronger forever."
RCA is not a single tool. It is a philosophy of inquiry supported by several complementary techniques. The two most widely used in manufacturing, supply chain, and service operations are the Fishbone (Ishikawa) Diagram and the 5 Whys. Used together, they form a powerful tandem: the Fishbone maps the landscape of possible causes, while 5 Whys drills vertically to the root.
When to Use Root Cause Analysis
RCA is appropriate when a problem is:
Recurring
The same failure keeps returning despite repeated fixes.
High-Impact
Significant cost, safety, quality, or customer satisfaction consequences.
Complex
Multiple contributing factors make the cause non-obvious.
Process-Based
The failure is systemic rather than a one-off random event.
The Fishbone (Ishikawa) Diagram
Developed by Professor Kaoru Ishikawa at the University of Tokyo in 1943 and popularised through his quality control work at Kawasaki shipyards, the Fishbone Diagram — also called the Cause-and-Effect Diagram or Ishikawa Diagram — is a visual brainstorming tool that maps all potential causes of a problem in a structured, category-based framework.
Its shape resembles a fish skeleton: the head is the problem (the effect), the spine is the central horizontal line, and the bones branching off the spine represent major cause categories. Sub-causes branch off each bone like smaller ribs.
The 6M Framework
The most widely used category system for manufacturing and operations is the 6M model:
| Category | What It Covers | Typical Example Causes |
|---|---|---|
| Man (People) | Human factors contributing to the problem | Inadequate training, fatigue, misinterpretation of procedures |
| Machine | Equipment, tools, technology | Worn tooling, lack of preventive maintenance, calibration drift |
| Method | Processes, procedures, work instructions | Outdated SOP, unclear sequence, missing Poka-Yoke controls |
| Material | Raw materials, components, consumables | Supplier non-conformance, improper storage, substitution |
| Measurement | Inspection, data collection, gauges | Measurement system error (MSA), sampling bias, untrained inspectors |
| Mother Nature (Environment) | Physical working conditions | Temperature fluctuation, humidity, vibration, contamination |
How to Build a Fishbone Diagram — Step by Step
Define the Problem
Write a precise, measurable problem statement. Place it in the fish head. Vague problems produce vague causes.
Draw the Spine
Draw a horizontal arrow pointing right to the problem. This is the backbone of the diagram.
Add Bone Categories
Draw diagonal lines (bones) off the spine. Label each with a cause category (6M, 4S, 8P).
Brainstorm Causes
Use a cross-functional team. Add causes as sub-bones. Ask "Could this cause the problem?" for each.
Add Sub-Causes
For each cause, branch smaller ribs with contributing sub-causes. Go at least two levels deep.
Prioritise & Verify
Circle the most likely causes. Use data, observation, or the 5 Whys to validate before acting.
The 5 Whys Technique
Pioneered by Sakichi Toyoda and embedded into the Toyota Production System (TPS), the 5 Whys is an iterative interrogation technique that progressively peels back layers of causation until the root cause is exposed. The premise is elegantly simple: ask "Why did this happen?" five times in succession, where each answer becomes the subject of the next "Why?"
The number five is a guideline, not a rule. Some root causes are reached in three iterations; others require seven. The correct stopping point is when the answer points to a controllable, systemic factor — a process gap, policy failure, or design flaw — rather than a person or a random event.
"Do not fix the symptom. Do not fix the first cause you find. Keep asking Why until you reach something the organisation can actually change permanently."
Worked Example: Production Line Stoppage
The following example traces a machine breakdown on a packaging line back to a systemic management failure using five iterations:
Fishbone + 5 Whys: The Power Combination
Neither tool is superior to the other — they operate on different axes. The Fishbone diagram is a horizontal brainstorming tool: it expands thinking by mapping every plausible cause category. The 5 Whys is a vertical drilling tool: it narrows thinking by pursuing one causal chain to its systemic origin.
The optimal workflow is to use them in sequence:
Use Fishbone First
Capture all potential causes across categories. Involve a cross-functional team to maximise coverage.
Prioritise Top Suspects
Use data (Pareto analysis, process observation) to identify the 2–3 most probable causes.
Apply 5 Whys
Run a 5 Whys chain on each prioritised cause. This reveals the systemic root beneath each candidate.
Act on the Root
Design a corrective action that addresses the root cause — a process, policy, or system change.
| Dimension | Fishbone Diagram | 5 Whys |
|---|---|---|
| Direction of thinking | Horizontal — breadth across categories | Vertical — depth into one causal chain |
| Team size | Best with a cross-functional group (5–10) | Can be done by an individual or small team |
| Output | Visual map of all possible causes | Single chain ending at one root cause |
| Strength | Ensures no major category is overlooked | Avoids stopping at intermediate symptoms |
| Risk | Can generate too many causes without prioritisation | Can follow the wrong path if the first "why" is incorrect |
| Best integrated with | Pareto analysis, FMEA, data collection | Fishbone, PDCA, A3 problem-solving |
Critical Mistakes That Undermine RCA
The most common and most damaging error. If your root cause ends at "operator error" or "negligence," you have not done RCA — you have done blame allocation. People fail for systemic reasons: inadequate training, unclear instructions, poor tool design, time pressure. The root cause is always the system that allowed the error to occur.
Accepting the first plausible cause as the root cause. "The machine broke down because it was old" is a symptom, not a root. Why was an old machine still in service without replacement or enhanced maintenance? That is where the investigation must go.
RCA conducted entirely in conference rooms without visiting the shop floor (Genchi Genbutsu — go and see) produces theoretical causes, not real ones. The actual conditions where the failure occurred must be observed.
Retraining the operator when the root cause is a missing procedure. Replacing the machine when the root is a lack of PM scheduling discipline. The corrective action must map directly to the identified root — not to an adjacent symptom.
Implementing a corrective action and declaring the problem solved without measuring whether the problem actually recurred. Every RCA must be closed with a defined follow-up period and a metric proving the root cause has been eliminated.
RCA in ISO 9001, Lean & Six Sigma
Root Cause Analysis is not merely a quality tool — it is a mandatory element in several major management frameworks:
| Framework | RCA Requirement | Primary RCA Tools |
|---|---|---|
| ISO 9001:2015 | Clause 10.2 — Nonconformity and corrective action: organisations must determine root causes and eliminate them to prevent recurrence | Fishbone, 5 Whys, 8D |
| Lean / TPS | Core discipline of the Toyota Production System; underpins Kaizen events and A3 problem-solving | 5 Whys, A3 Report |
| Six Sigma DMAIC | Analyse phase — identify root causes of variation before designing solutions | Fishbone, FMEA, Regression, MSA |
| IATF 16949 | Automotive quality standard mandates containment, root cause analysis, and systemic corrective action for all significant nonconformances | 8D, Fishbone, FMEA, DVP&R |
| DMAIC / PDCA | RCA sits at the Analyse / Check phase — essential for moving from diagnosis to solution design | All major RCA tools |
The Discipline of Permanent Elimination
Root Cause Analysis is the difference between organisations that fight the same fires year after year and those that systematically eliminate failure from their processes. The Fishbone Diagram gives you the map; the 5 Whys gives you the excavation tool. Used together, with rigour and intellectual honesty, they reveal not that your people are failing — but that your systems are asking too much of imperfect humans without adequate design support.
The measure of a mature quality culture is not how quickly it responds to problems. It is how reliably it ensures the same problem never returns. That commitment begins with Root Cause Analysis.
"Fix the process, not the person. Fix the system, not the symptom. That is the only RCA that lasts."
| Quick Reference: RCA Toolkit | Best For |
|---|---|
| Fishbone / Ishikawa Diagram | Brainstorming all possible causes across structured categories |
| 5 Whys | Drilling from a symptom to a systemic root cause |
| Pareto Analysis (80/20) | Prioritising which causes to investigate first |
| FMEA | Proactive failure mode prevention before problems occur |
| 8D Report | Formal structured RCA for customer complaints (automotive/IATF) |
| A3 Problem Solving | Lean single-page structured problem-solving with RCA embedded |

1 Comment