
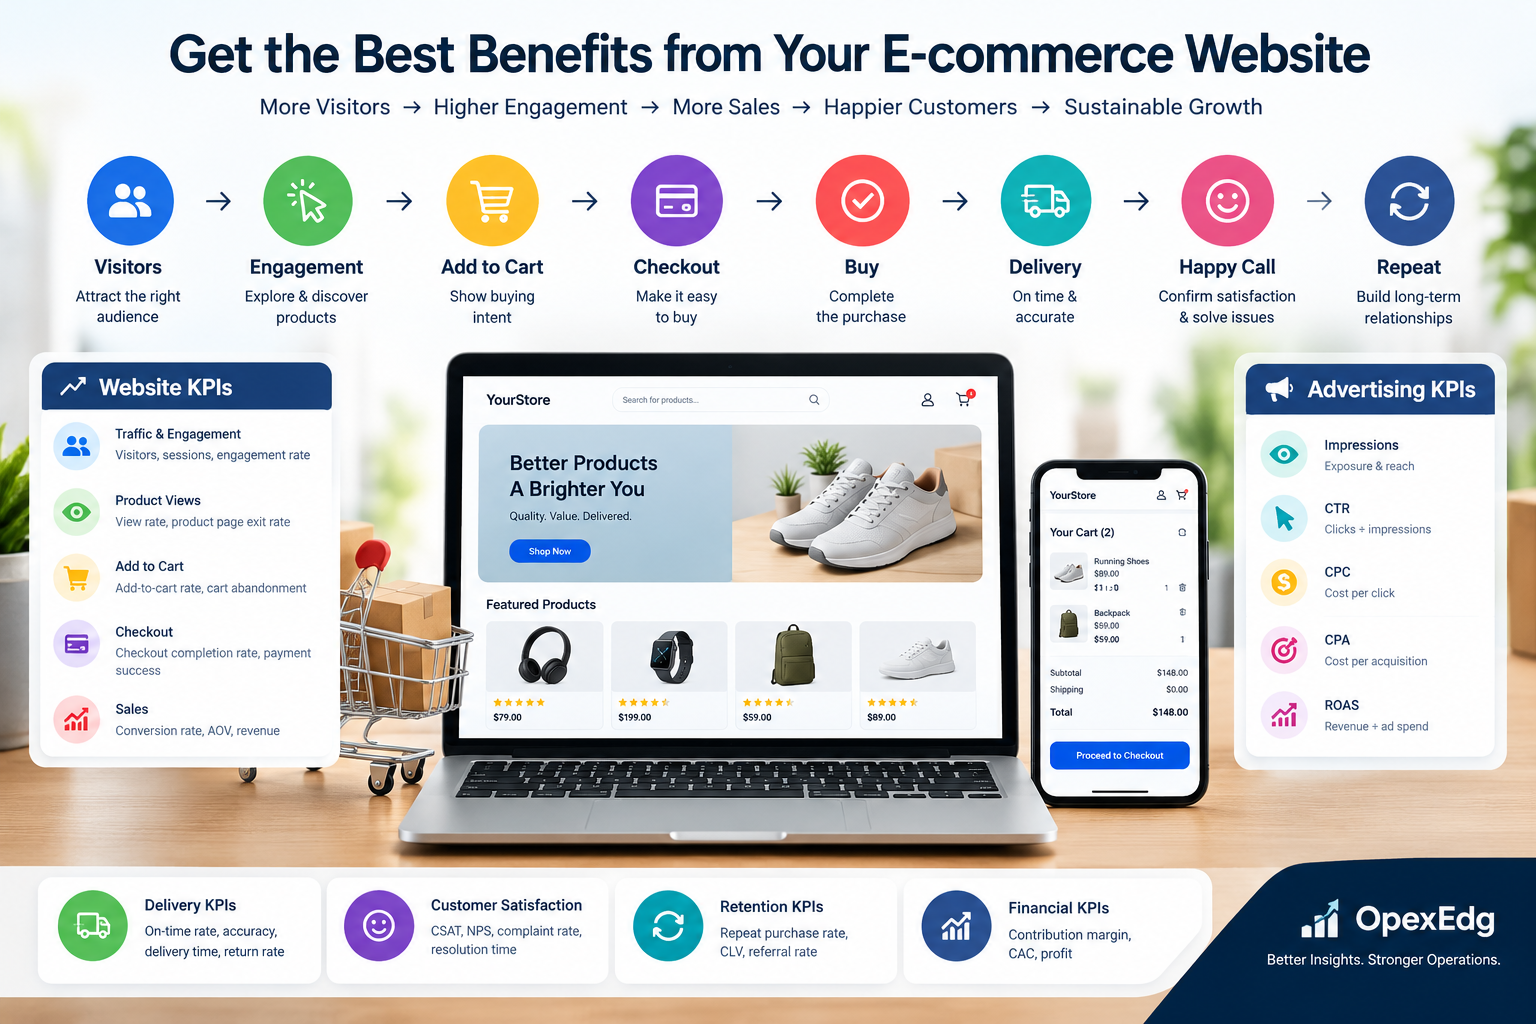
Your E-commerce Website Is More Than an Online Store
An e-commerce website is not simply a digital catalog where customers browse products and place orders. It is an integrated business system that connects marketing, customer experience, sales, payment processing, logistics, customer service, and continuous improvement.
Many businesses invest heavily in website design, advertising campaigns, search engine optimization (SEO), and social media promotion. However, generating website traffic does not necessarily generate profitable sales. Visitors may leave without interacting, interested shoppers may abandon their carts, customers may encounter difficulties during checkout, and delivered orders may fail to create a positive customer experience.
The real opportunity is to optimize the entire customer journey—from the first advertisement or search result to the moment a customer receives an order, becomes satisfied, and decides to purchase again.
To achieve this, businesses must manage their e-commerce website as a measurable performance system. Each stage should have clear objectives, relevant key performance indicators (KPIs), reliable data, and improvement actions.
The central principle is simple:
Do not optimize your e-commerce website for traffic alone. Optimize it for profitable conversions, reliable fulfillment, customer satisfaction, and long-term customer value.
This article explains how to achieve that objective and how to connect website performance with advertising KPIs to make better business decisions.
1. Understand the Complete E-commerce Customer Journey
A successful e-commerce operation follows a sequence of connected stages.
- Attract: Bring relevant visitors to the website through paid advertising, SEO, social media, referrals, and other channels.
- Engage: Help visitors understand the offer, explore products, and build confidence in the business.
- Consider: Encourage visitors to evaluate product features, prices, reviews, delivery options, and alternatives.
- Add to cart: Convert product interest into a measurable buying intention.
- Checkout: Make it easy for customers to complete their orders.
- Purchase: Confirm the transaction, capture payment, and communicate the order details.
- Deliver: Fulfill the order accurately, on time, and in good condition.
- Satisfy: Confirm that the customer received the expected value and resolve any problems.
- Retain and recommend: Encourage repeat purchases, reviews, referrals, and lasting customer relationships.
Each stage influences the next. Poor advertising quality can attract visitors who never intend to buy. Weak product information can reduce cart additions. Unexpected shipping fees can cause checkout abandonment. Late deliveries can damage satisfaction even when the website and payment process work perfectly.
Consequently, optimizing one stage in isolation is rarely enough. The business must improve the complete system.
2. Attract the Right Visitors, Not Just More Visitors
Website traffic is the starting point of e-commerce performance, but traffic volume alone is not a reliable measure of success.
A website receiving 50,000 visitors who have little interest in its products may perform worse than one receiving 5,000 highly relevant visitors.
How to attract qualified traffic
Search engine optimization (SEO): Create useful category pages, detailed product descriptions, informative articles, and content that answers customers’ questions. Match each page to the search intent of its audience.
Paid advertising: Use Google Ads, Meta Ads, and other relevant advertising platforms to reach people whose interests, searches, or purchase intentions match the products offered.
Social media: Publish useful product demonstrations, comparisons, customer stories, and educational content that encourages qualified users to visit the website.
Referral and partnership channels: Work with relevant publishers, creators, affiliates, and business partners whose audiences match the target market.
Remarketing: Reconnect with eligible previous visitors who viewed products or abandoned carts, subject to applicable consent requirements and platform policies.
Measure traffic quality
| KPI | Meaning | Why it matters |
| Users or visitors | People visiting the website, as defined by the analytics platform | Measures audience reach |
| Sessions | Visits to the website | Measures browsing activity |
| Traffic source | Where visits originate | Shows which channels attract visitors |
| Engagement rate | Share of sessions meeting the analytics platform’s engagement criteria | Helps assess meaningful interaction |
| Cost per click (CPC) | Advertising cost divided by clicks | Measures the cost of attracting traffic |
| Cost per engaged session | Advertising spend divided by engaged sessions attributed to the campaign | Helps evaluate traffic quality |
| New versus returning users | Distribution of first-time and returning visitors | Provides insight into audience development |
Google Analytics 4 (GA4) provides recommended e-commerce events and engagement reporting, but meaningful product interactions must be implemented and verified correctly. See Google’s e-commerce measurement documentation.
Management insight: If traffic increases but product views, cart additions, and purchases do not, investigate visitor intent, advertising targeting, landing-page relevance, and website usability before increasing the marketing budget.
- Turn Visitors into Engaged Shoppers
Once a visitor arrives, the website must quickly answer three questions:
- Is this product or service relevant to me?
- Why should I buy it from this business?
- Can I trust this business to deliver what it promises?
A website that fails to answer these questions clearly may lose customers before they even consider purchasing.
Improve the product discovery experience
Make navigation intuitive and provide effective search, category filters, sorting, and relevant product recommendations.
Product pages should contain:
- Clear product titles and high-quality images.
- Accurate descriptions, specifications, and dimensions.
- Transparent prices, discounts, and availability.
- Clear delivery costs and estimated delivery times.
- Customer reviews and ratings where available and authentic.
- Warranty, return, refund, and support information.
- Prominent calls to action, especially the Add to Cart button.
Reduce friction and build trust
Ensure the website works well on mobile devices, loads efficiently, and provides a consistent experience across browsers and devices.
Display genuine trust signals, secure payment options, accessible customer support, and transparent business policies. Avoid misleading discounts, artificial urgency, hidden charges, or unsupported product claims.
Engagement KPIs
| KPI | Formula or definition | Management use |
| Product view rate | Sessions or users viewing products ÷ total sessions or users, using a consistent basis | Measures product discovery |
| Engagement rate | Engaged sessions ÷ total sessions | Measures meaningful website visits |
| Search usage rate | Sessions using site search ÷ total sessions | Identifies demand for product discovery |
| Product page exit rate | Exits from product pages ÷ views of those pages, using a consistent definition | Helps identify pages needing improvement |
| Product-to-cart rate | Product views that lead to cart additions ÷ product views | Measures how effectively product pages convert interest into intent |
Use consistent denominators when calculating rates. User-based and session-based calculations answer different questions and should not be mixed in the same trend.
Management insight: High product views combined with low cart additions may indicate poor product presentation, uncompetitive pricing, weak value propositions, missing information, unavailable inventory, or unexpected delivery costs.
- Optimize the Add-to-Cart Stage
Adding a product to the cart is a stronger buying signal than simply viewing it. However, it is not a completed sale.
A business should understand which products are added, which are removed, how cart value changes, and what prevents customers from proceeding to checkout.
Practical improvement actions
Make the next step obvious. Place a visible Add to Cart button near the main product information.
Clarify the offer. Explain product benefits, available sizes or variants, stock status, and any conditions affecting the final price.
Provide transparent costs. Where possible, show shipping estimates and applicable fees before checkout.
Recommend relevant complementary products. Offer genuinely useful accessories or bundles without distracting customers from their original purchase.
Preserve the cart. Where technically and legally appropriate, maintain cart contents when users return to the website.
Test the buying experience. Compare alternative product layouts, button labels, product images, and shipping messages through controlled experiments.
Essential cart KPIs
| KPI | Formula | What it tells you |
| Add-to-cart rate | Sessions with at least one cart addition ÷ eligible sessions | How often visits generate buying intent |
| Product add-to-cart rate | Product views that result in cart additions ÷ product views | Which products convert interest into intent |
| Cart abandonment rate | (Carts created − carts converted into purchases) ÷ carts created | How many created carts fail to become orders |
| Average cart value | Cart value ÷ carts measured | The value of shopping carts |
| Cart removal rate | Cart-removal events or affected carts ÷ the relevant cart activity or cohort | Whether customers reconsider their selections |
Cart abandonment is sensitive to the measurement method. For example, comparing carts created during a period with purchases completed during the same period may be misleading if customers complete purchases later. Use a defined cohort and attribution window whenever possible.
Management insight: A healthy add-to-cart rate with a poor purchase rate suggests that the main problem may occur after product selection. Investigate checkout friction, payment failures, delivery costs, and customer confidence before redesigning the product pages.
- Improve Checkout and Reduce Abandoned Orders
Checkout is one of the most important stages because customers have already demonstrated purchase intent. Every unnecessary field, unexpected charge, confusing instruction, or payment error creates another opportunity to lose the sale.
Build a customer-friendly checkout
- Offer guest checkout where appropriate.
- Request only the information necessary to fulfill the order.
- Display the total cost, taxes, shipping charges, and discounts clearly.
- Show delivery estimates before the customer commits to payment.
- Provide suitable, secure payment methods for the target market.
- Validate form fields clearly and explain errors in plain language.
- Optimize the process for mobile devices.
- Allow customers to review and correct their orders.
- Send clear order confirmation and payment-status messages.
- Monitor payment failures and technical errors.
Checkout KPIs
| KPI | Formula | Interpretation |
| Checkout initiation rate | Sessions starting checkout ÷ sessions with cart activity | Measures progression from cart to checkout |
| Checkout completion rate | Completed purchases ÷ checkout starts | Measures checkout effectiveness |
| Checkout abandonment rate | (Checkout starts − completed purchases) ÷ checkout starts | Measures checkout losses |
| Payment success rate | Successful payment attempts ÷ total payment attempts | Measures payment reliability |
| Payment failure rate | Failed payment attempts ÷ total payment attempts | Identifies payment friction |
| Checkout duration | Time from checkout initiation to completion | Helps detect unnecessary complexity |
Use the same unit of analysis throughout each calculation. For example, a session-based checkout completion rate should use session-based starts and purchases, while an order-attempt analysis should use consistent transaction records.
GA4 supports recommended events such as begin_checkout, add_shipping_info, add_payment_info, and purchase. These events help businesses identify where customers leave the purchase process. Source: Google Analytics e-commerce events.
Management insight: If many customers start checkout but few complete it, analyze the abandonment point by device, payment method, delivery destination, traffic source, and product category. Fix the largest verified cause first.
- Convert Completed Purchases into Profitable Sales
A completed transaction is an important milestone, but revenue alone does not tell the whole story.
The business must also consider discounts, product costs, shipping and fulfillment expenses, payment fees, returns, customer acquisition costs, and the resources required to serve each order.
Measure sales performance
| KPI | Formula | Business value |
| Purchase conversion rate | Purchases ÷ sessions × 100, using a defined reporting method | Measures the effectiveness of converting visits into orders |
| Total sales revenue | Sum of recognized or reported sales for the chosen definition | Measures sales output |
| Average order value (AOV) | Revenue ÷ number of orders | Measures average order size |
| Gross profit | Net sales revenue − cost of goods sold | Measures product-level profitability before other expenses |
| Contribution margin | Net sales revenue − variable costs | Shows what remains to cover fixed costs and profit |
| Customer acquisition cost (CAC) | Acquisition expenses ÷ new customers acquired | Measures the cost of gaining customers |
Define revenue consistently. Depending on the business and reporting system, sales revenue may exclude canceled orders, refunds, taxes, or shipping charges. Document the definition so that website analytics, accounting, and advertising reports can be reconciled.
Increase order value responsibly
- Recommend complementary products that improve the customer’s purchase.
- Offer useful product bundles.
- Set free-shipping thresholds only after evaluating the economics.
- Present relevant upgrades or larger quantities.
- Use cross-selling and upselling where they improve customer value.
Avoid increasing average order value at the expense of conversion rate, customer trust, or profitability.
Management insight: The best outcome is not necessarily the highest number of orders or the highest AOV. It is the best sustainable contribution from customers while maintaining a positive buying experience.
- Treat Delivery as Part of the Customer Experience
The customer journey does not end when payment succeeds. Delivery is the point where the business must fulfill the promise made by its website and advertising.
A technically excellent website cannot compensate indefinitely for inaccurate orders, damaged products, poor packaging, or repeated delays.
Improve order fulfillment
- Maintain accurate inventory information.
- Validate orders and payment status before dispatch.
- Use reliable picking, packing, and shipping processes.
- Provide realistic delivery estimates.
- Send order confirmation, dispatch notifications, and tracking information.
- Establish a clear process for delayed, lost, or damaged shipments.
- Make returns, exchanges, and refunds understandable and accessible.
- Monitor logistics partners against agreed service levels.
Delivery and fulfillment KPIs
| KPI | Formula | Purpose |
| On-time delivery rate | Orders delivered by the promised date ÷ orders due for delivery | Measures delivery reliability |
| Order accuracy rate | Correctly fulfilled orders ÷ orders fulfilled | Measures fulfillment quality |
| Average delivery time | Total elapsed delivery time ÷ delivered orders | Measures delivery speed |
| Order cancellation rate | Canceled orders ÷ total orders, using a defined cohort | Measures lost transactions |
| Return rate | Returned orders or units ÷ corresponding delivered orders or units | Identifies product or fulfillment problems |
| Cost per order fulfilled | Relevant fulfillment costs ÷ orders fulfilled | Measures logistics efficiency |
Report delivery times by region, carrier, shipping method, and product category where the volume supports meaningful comparisons.
Management insight: A rising return rate may indicate inaccurate descriptions, poor sizing information, product defects, damaged delivery, or mismatched customer expectations. Analyze return reasons rather than assuming that every return is a logistics issue.
- Use the Happy Call to Measure Satisfaction and Prevent Customer Loss
A happy call is a proactive customer follow-up intended to confirm that the customer received the order, the product meets expectations, and any problems are resolved.
It can be particularly valuable for high-value orders, complex products, first-time customers, business-to-business transactions, and products requiring installation or guidance.
A happy call should not become an intrusive sales pitch. Its purpose is to protect the customer relationship and identify improvement opportunities.
A practical happy-call process
Step 1: Select the right customers.
Prioritize orders with a high value, delivery exceptions, new customers, complex products, or other defined service requirements. For ordinary low-value orders, a short email, SMS, or customer-service message may be more efficient than a phone call.
Step 2: Contact customers at the appropriate time.
Confirm delivery first. Contact the customer after the order has arrived and allow enough time for initial inspection or use.
Step 3: Ask useful questions.
- Did the order arrive as expected?
- Was the product in good condition?
- Does it meet your expectations?
- Was ordering and payment straightforward?
- Is there anything we can improve or help you with?
Step 4: Resolve issues.
Record complaints, assign responsibility, communicate a resolution date, and follow up until the issue is closed.
Step 5: Capture improvement opportunities.
Categorize feedback into product quality, website information, payment, packaging, delivery, customer service, and other relevant areas.
Step 6: Close the loop.
Share recurring issues with the responsible teams and verify whether corrective actions reduce future complaints.
Customer satisfaction KPIs
| KPI | Definition | What it reveals |
| Customer satisfaction score (CSAT) | Satisfied responses ÷ valid survey responses × 100, using a defined satisfaction threshold | Satisfaction with a product or service interaction |
| Net Promoter Score (NPS) | Percentage of promoters − percentage of detractors | Customer willingness to recommend |
| Complaint rate | Orders generating complaints ÷ orders delivered | Frequency of reported problems |
| First-contact resolution rate | Eligible issues resolved on the first contact ÷ eligible issues handled | Effectiveness of customer support |
| Happy-call completion rate | Successful eligible follow-ups ÷ eligible follow-ups due | Execution of the follow-up process |
| Issue resolution time | Time from issue reporting to resolution | Speed of service recovery |
| Repeat purchase rate | Customers making another purchase within a defined period ÷ eligible customers in the original cohort | Customer retention |
A survey score is not automatically representative of all customers. Report the number of responses and response rate, and consider differences between respondents and nonrespondents.
Management insight: A high purchase conversion rate combined with low satisfaction and high returns can indicate that the business is selling effectively but failing to fulfill customer expectations. Sustainable e-commerce performance requires both.
- Convert Satisfied Customers into Repeat Buyers
Acquiring a new customer is only one way to generate revenue. Existing customers may provide additional value through repeat purchases, complementary products, subscriptions, referrals, and positive reviews.
Retention is especially important when acquisition costs are high or products are purchased repeatedly.
Practical retention strategies
- Send useful post-purchase guidance.
- Provide proactive support for product setup and use.
- Recommend relevant complementary products.
- Send replenishment reminders when appropriate.
- Develop loyalty benefits that reward meaningful customer behavior.
- Request honest reviews after customers have had time to experience the product.
- Use personalized campaigns based on legitimate customer preferences and applicable consent.
- Reactivate inactive customers with relevant offers rather than indiscriminate messaging.
Retention KPIs
Repeat purchase rate
[
\text{Repeat Purchase Rate}=
\frac{\text{Customers with 2+ purchases}}
{\text{Eligible customers}}\times100
]
Customer lifetime value (CLV or LTV) estimates the value a customer generates over the relationship with the business. For decision-making, a contribution-based estimate is often more useful than revenue alone.
Customer retention rate measures the share of customers retained over a defined period, using a consistent cohort and customer definition.
Revenue per customer measures revenue generated by a customer or customer cohort over a defined period.
Referral rate measures the proportion of customers or orders attributable to referrals, provided the attribution method is reliable.
The objective is not simply to make customers buy again. It is to build profitable, trustworthy relationships that encourage customers to return because the business consistently delivers value.
- Connect Website KPIs with Advertising KPIs
Website analytics explains what customers do after arriving. Advertising analytics helps explain how much it costs to attract them, how campaigns influence conversions, and whether the resulting business value justifies the investment.
Connecting these two perspectives is essential for making informed marketing decisions.
For example, a campaign may generate many inexpensive clicks but very few purchases. Another campaign may attract fewer visitors at a higher CPC yet produce more profitable orders.
The correct decision depends on the entire journey, not the click price alone.
Advertising KPIs and their meaning
| Advertising KPI | Formula | What it tells you |
| Impressions | Number of times an ad is shown | Measures exposure |
| Click-through rate (CTR) | Clicks ÷ impressions × 100 | Measures how frequently impressions lead to clicks |
| Cost per click (CPC) | Ad spend ÷ clicks | Measures the average cost of a click |
| Cost per thousand impressions (CPM) | Ad spend ÷ impressions × 1,000 | Measures the cost of exposure |
| Conversion rate | Attributed conversions ÷ eligible ad interactions × 100, according to the platform’s definition | Measures how effectively ad interactions produce conversions |
| Cost per acquisition (CPA) | Ad spend ÷ attributed conversions | Measures the cost of a defined conversion |
| Return on ad spend (ROAS) | Attributed conversion value ÷ ad spend | Measures the revenue or other assigned value generated per unit of advertising spend |
| Advertising return on investment (ROI) | Attributable profit after relevant advertising costs ÷ advertising investment × 100, under a defined methodology | Evaluates profitability rather than revenue alone |
These metrics are related, but they answer different questions.
CTR: Is the advertisement attracting attention?
A low CTR may indicate that the ad message, creative, offer, audience, or placement is not relevant enough.
A high CTR does not guarantee sales. An ad can attract clicks by making a promise that the landing page or product cannot fulfill.
CPC: How much does it cost to attract a click?
CPC helps compare traffic costs, but the lowest CPC is not necessarily the best choice.
A more expensive click may be worthwhile if it produces a higher purchase conversion rate, a larger order value, or better customer profitability.
CPA: How much does it cost to generate a conversion?
CPA depends on what the business defines as a conversion. A campaign optimized for newsletter sign-ups should not be compared directly with one optimized for completed purchases without accounting for the difference.
For an e-commerce store, completed and validated purchases are generally a more meaningful primary conversion than product views or cart additions.
ROAS: How much value does advertising generate?
Suppose a campaign spends $1,000 and generates $4,000 in attributed purchase revenue.
[
\text{ROAS}=\frac{$4,000}{$1,000}=4.0
]
This equals a 4:1 ROAS, or 400%, meaning $4 in attributed revenue for every $1 spent on advertising.
However, ROAS is not the same as profit. The business must still pay for products, fulfillment, payment processing, returns, and other operating expenses.
Google Ads documents conversion value divided by advertising cost as a measure of conversion value per cost. Its usefulness depends on accurate conversion tracking and meaningful assigned values. Source: Google Ads conversion values.
Why advertising KPIs must connect to website KPIs
Consider this diagnostic framework:
| Observed result | Possible cause | Recommended investigation |
| High impressions, low CTR | Weak ad relevance or creative | Review audience, message, offer, and search intent |
| High CTR, low engagement | Poor landing-page relevance or slow loading | Compare the ad promise with the landing-page experience |
| Strong engagement, low add-to-cart rate | Weak product presentation, price, or offer | Analyze product-page behavior and customer objections |
| Strong add-to-cart rate, low checkout initiation | Cart friction or unexpected costs | Review cart layout, shipping transparency, and calls to action |
| Strong checkout initiation, low purchase rate | Payment, delivery, trust, or technical problems | Segment checkout losses by device and failure reason |
| Good conversion rate, poor ROAS | High acquisition cost or low order value | Review campaign economics, order values, and product mix |
| Good ROAS, poor profit | Thin margins, returns, or high variable costs | Calculate contribution after advertising and fulfillment |
| Good first-purchase results, weak retention | Poor post-purchase experience or weak product-market fit | Analyze delivery, satisfaction, returns, and repeat buying |
The important principle is that every KPI should lead to a business question and, where possible, a specific improvement action.
- Understand the Difference Between Website KPIs and Advertising KPIs
A common reporting mistake is to treat all dashboards as if they measure the same thing.
They do not.
Website KPIs measure behavior and outcomes across the store, such as product views, cart additions, checkout completion, purchases, and revenue.
Advertising KPIs measure the performance attributed to advertising interactions, such as impressions, clicks, CPC, CPA, and ROAS.
Operational KPIs measure the delivery of the customer promise, such as fulfillment accuracy, delivery time, complaint rate, and refund rate.
Financial KPIs measure the economic result, including contribution margin, acquisition cost, customer lifetime value, and profit.
These perspectives must be reconciled rather than treated as interchangeable.
For example, an advertising platform may attribute a purchase to a campaign while GA4 attributes the same purchase differently because the platforms use different attribution models, reporting windows, and eligibility rules. Orders may also be canceled or refunded after the original conversion has been recorded.
To improve measurement reliability:
- Use consistent purchase and transaction identifiers where supported.
- Verify that purchase events fire once per transaction.
- Send accurate transaction values and currencies.
- Track cancellations and refunds.
- Compare reporting periods and attribution windows consistently.
- Separate new and returning customers where possible.
- Document differences between platform-attributed and business-recorded results.
Google provides guidance on implementing e-commerce events and assigning conversion values in GA4 and Google Ads.
- Build a Practical E-commerce KPI Dashboard
A dashboard should help managers identify where performance is deteriorating, understand why, and prioritize corrective action.
It should not simply display as many metrics as possible.
A useful management dashboard has four levels.
Level 1: Business outcomes
Track:
- Net sales revenue.
- Number of completed orders.
- Purchase conversion rate.
- Average order value.
- Contribution after variable costs and advertising.
- Return and cancellation rates.
- Repeat purchase rate.
Level 2: Customer journey
Track:
- Qualified traffic and engagement.
- Product view rate.
- Add-to-cart rate.
- Cart-to-checkout progression.
- Checkout completion rate.
- Payment success rate.
- Delivery performance.
- Customer satisfaction.
Level 3: Marketing efficiency
Track:
- Advertising spend.
- CTR, CPC, and CPM.
- Purchase CPA.
- Attributed purchase revenue.
- ROAS.
- New-customer acquisition cost.
- Campaign-level conversion rates.
Level 4: Diagnostic indicators
Track:
- Page speed and technical errors.
- Product availability.
- Checkout abandonment by device.
- Payment failures by method.
- Customer complaints by category.
- Delivery exceptions by carrier or region.
- Return reasons by product.
- Tracking discrepancies between analytics and order records.
Recommended review frequency
| Frequency | Review focus |
| Daily | Spend, orders, revenue, payment failures, stock issues, and major technical incidents |
| Weekly | Funnel conversion, cart abandonment, campaign performance, delivery issues, and corrective actions |
| Monthly | Profitability, customer acquisition cost, retention, returns, and product or channel performance |
| Quarterly | Strategic positioning, customer lifetime value, channel mix, service design, and improvement priorities |
Review frequency should reflect business volume and risk. A large store may need automated daily alerts, while a small store may obtain more meaningful insights from weekly trends.
- Use Root-Cause Analysis Instead of Guesswork
When a KPI deteriorates, the first response should not automatically be to increase advertising spending or redesign the website.
Use a structured improvement process:
- Define the problem. Identify the KPI, baseline, target, affected segment, and period.
- Validate the data. Confirm tracking accuracy and rule out technical or reporting changes.
- Locate the problem stage. Determine whether the issue occurs during acquisition, product discovery, cart, checkout, fulfillment, or retention.
- Investigate potential causes. Use customer feedback, analytics segmentation, error logs, order records, and controlled tests.
- Prioritize the largest opportunity. Consider financial impact, customer impact, implementation effort, and confidence in the diagnosis.
- Implement a corrective action. Assign an owner and a deadline.
- Measure the result. Compare performance against the baseline while accounting for seasonality and other changes.
- Standardize successful improvements. Document the new process and monitor whether the gain persists.
This approach transforms the website from a static sales channel into a continuously improving business process.
- Illustrative Example: How Funnel Improvements Increase Sales
Consider a hypothetical e-commerce website receiving 20,000 sessions per month.
Assume its initial funnel performs as follows:
| Stage | Initial result |
| Monthly sessions | 20,000 |
| Sessions with an add-to-cart event | 1,000 |
| Checkout starts | 600 |
| Completed purchases | 300 |
| Purchase conversion rate | 1.5% |
The business then improves product pages, clarifies delivery charges, and simplifies checkout.
Assume that, after implementation, the same monthly traffic generates:
| Stage | Improved result |
| Monthly sessions | 20,000 |
| Sessions with an add-to-cart event | 1,200 |
| Checkout starts | 780 |
| Completed purchases | 468 |
| Purchase conversion rate | 2.34% |
Under these illustrative assumptions, completed purchases increase from 300 to 468 per month, a 56% increase, without increasing traffic.
If average order value remains constant at $50, monthly sales revenue rises from $15,000 to $23,400, an increase of $8,400.
This is an illustration, not a forecast or a guaranteed result. Actual performance depends on traffic quality, customer demand, margins, seasonality, implementation quality, and other factors. The example demonstrates why improving conversion at multiple funnel stages can be more valuable than focusing exclusively on traffic growth.
- A 90-Day Roadmap for E-commerce Performance Improvement
Days 1–30: Establish measurement and identify losses
- Audit GA4 and advertising conversion tracking.
- Validate purchase events, transaction IDs, revenue, and currencies.
- Establish baseline KPIs for traffic, product views, cart, checkout, and purchases.
- Review mobile usability and checkout performance.
- Analyze the main reasons for returns, complaints, and delivery failures.
- Identify the three largest measurable performance gaps.
Deliverable: A validated KPI baseline and prioritized improvement plan.
Days 31–60: Improve conversion and operational reliability
- Improve the highest-impact product pages.
- Clarify prices, delivery charges, and return policies.
- Reduce unnecessary checkout fields.
- Fix payment and tracking errors.
- Improve order-status communications.
- Introduce a structured post-delivery satisfaction follow-up.
- Test selected changes and measure their impact.
Deliverable: Implemented improvements with measurable results and documented ownership.
Days 61–90: Optimize advertising and customer retention
- Compare advertising campaigns by completed purchases, CPA, and ROAS.
- Review campaign profitability using contribution margin rather than revenue alone.
- Reallocate spending toward channels that meet the business’s economic objectives.
- Introduce relevant repeat-purchase and customer retention campaigns.
- Review customer satisfaction, refunds, and delivery performance together.
- Establish a recurring KPI review and continuous-improvement cycle.
Deliverable: An integrated performance dashboard and an ongoing improvement process.
Conclusion: Manage the Entire Customer Journey, Not Just the Website
The full benefit of an e-commerce website comes from aligning marketing, customer experience, conversion, order fulfillment, customer service, and financial performance.
Traffic creates opportunities. Engagement builds interest. Product pages turn interest into buying intent. Cart and checkout optimization help convert that intent into orders. Reliable delivery fulfills the promise. Customer satisfaction protects trust, while retention and referrals create opportunities for sustainable growth.
KPIs make each stage measurable. Advertising metrics explain the cost and attributed value of acquiring customers, while operational and financial metrics reveal whether the business can fulfill orders profitably and maintain customer relationships.
The most effective e-commerce strategy is therefore not to maximize a single metric. It is to build a connected system in which every stage has a clear objective, reliable measurement, an accountable owner, and a continuous-improvement process.
The ultimate goal is to acquire the right customers, convert them efficiently, fulfill their expectations, and generate sustainable profit through long-term customer value.
For businesses seeking stronger operational performance, this is the difference between simply operating an online store and managing an integrated, data-driven e-commerce business.
FAQ section
-
What are the most important KPIs for an e-commerce website?
-
How can I increase my add-to-cart rate?
-
What causes checkout abandonment, and how can I reduce it?
-
What is the difference between conversion rate, CPA, and ROAS?
-
How can I determine whether my advertising campaigns are profitable?
-
Why should customer satisfaction and delivery performance be included in e-commerce KPIs?
-
How can happy calls improve customer retention?
-
How often should I review my e-commerce performance dashboard?
Related Topics
Project Management Excellence: Delivering Strategic Projects on Time, Within Budget, and Beyond Expectations
Pricing, CRM, Customer Success & Sales Forecasting: The Complete Revenue Growth Framework
Marketing Excellence: The Complete Framework for Sustainable Business Growth
Inventory Optimization, Safety Stock & ABC/XYZ Analysis: The Complete Guide to Lower Inventory Costs While Improving Service Levels
Financial Excellence: Building a High-Performance Organization Through Strategic Financial Management
AI-Powered Business: Transforming Organizations Through Intelligent Execution
After-Sales Service Excellence: The Competitive Advantage That Drives Customer Loyalty and Sustainable Growth
Sustainability Strategy for Business Excellence | ESG & Operational Performance | OpexEdge
Business Model Design: Building a Profitable Business That Can Scale
Market Opportunity Assessment The Strategic Foundation for Sustainable Business Growth
Market Survey: The Strategic Foundation for Smarter Business Decisions
Warranty Management: Turning Warranty Costs into Customer Trust and Operational Excellence
Focus Groups: The Complete Guide to Understanding Customers and Making Better Business Decisions
The Complete Product & Service Lifecycle Framework | OpexEdge Consultancy
Sales Funnel: The Journey to Generate Conversions
User Experience Interface Design: Turning Digital Interfaces into Business Performance
Voice of the Customer Study: How to Turn Customer Feedback into Business Growth
How to Get the Best Benefits from Your E-commerce Website: A Complete Guide to Customer Engagement, Conversion, Delivery, and Performance KPIs

META ads platform defers from google ads platform , must check what is suitable for your business