
How to Identify the Products That Shape Customer Price Perception
Introduction
A supermarket may carry 10,000, 30,000, or even 50,000 SKUs.
But customers do not evaluate the price of every product.
They remember some prices.
They compare some products across retailers.
They repeatedly purchase some items.
And they use these products—consciously or unconsciously—to answer one important question:
“Is this supermarket expensive or reasonably priced?”
These products are often referred to as:
Key Value Items — KVI
KVI identification is therefore one of the most important foundations of grocery retail pricing strategy.
The objective is not to find the cheapest products.
It is to identify the products that have the greatest influence on customer price perception, then manage their prices strategically.
This creates a fundamental principle:
You do not need to win the price war on every SKU. You need to win it on the products customers use to judge your prices.
- What Is a KVI?
A Key Value Item (KVI) is a product that has a disproportionately strong influence on how customers perceive a retailer’s overall price level.
A KVI typically has several characteristics:
- High purchase frequency
- High customer awareness
- High price sensitivity
- Strong competitive comparability
- Significant sales volume
- Strong relevance to the customer’s shopping mission
- Availability across competing retailers
- Potential influence on store choice
However, there is no universal list of KVIs.
A product can be a KVI for one retailer and a normal SKU for another.
For example:
Milk
may be a major KVI in a neighborhood supermarket.
But a specialty retailer serving a premium customer segment may have a completely different KVI structure.
Therefore:
KVI identification is a retailer-specific analytical exercise.
- Why KVI Identification Matters
Suppose a supermarket has:
20,000 SKUs
It cannot realistically monitor every competitor price every hour.
Even if it could, doing so would not necessarily create value.
Instead, the retailer should identify a smaller group of strategically important products.
For example:
20,000 total SKUs
→ 4,000 important products
→ 1,000 highly important products
→ 300–500 core KVIs
The exact numbers depend on the retailer.
The principle is what matters:
Focus pricing intelligence where it has the greatest commercial impact.
This creates three major benefits.
- Better Price Perception
The retailer becomes more competitive on visible products.
- Better Margin Protection
The retailer avoids unnecessary price reductions across the entire assortment.
- Better Competitive Intelligence
Pricing teams can monitor competitors more efficiently.
- KVI Is Not the Same as Best-Selling Product
One of the most common mistakes is:
“Our best-selling products are our KVIs.”
Not necessarily.
A product can have very high sales but low influence on price perception.
Another product may have relatively modest sales but extremely high customer price awareness.
Consider:
| Product | Sales Volume | Price Awareness | Competition | KVI Potential |
| Milk | High | High | High | Very High |
| Premium Olive Oil | Medium | Medium | High | Medium |
| Specialty Sauce | Low | Low | Medium | Low |
| Bottled Water | High | High | High | Very High |
| Imported Cheese | Low | Low | Low | Low |
Therefore:
Sales volume is one input—not the definition of a KVI.
- The KVI Identification Framework
A practical KVI model can evaluate each SKU across several dimensions.
One useful framework contains seven factors:
- Purchase Frequency
How often do customers buy the product?
- Customer Price Awareness
How likely are customers to know its price?
- Price Sensitivity
How strongly does demand react to price changes?
- Competitive Availability
How easily can customers compare the product elsewhere?
- Sales Importance
How significant is the product’s sales volume?
- Basket Influence
How strongly does the product influence other purchases?
- Store Choice Influence
Could the product influence where the customer decides to shop?
These factors can be combined into a KVI Score.
- A Practical KVI Scoring Model
Suppose we score each factor from:
1 = Low
to:
5 = Very High
We could calculate:
KVI Score =
- Purchase Frequency × 20%
- Price Awareness × 20%
- Price Sensitivity × 20%
- Competitive Availability × 15%
- Sales Importance × 10%
- Basket Influence × 10%
- Store Choice Influence × 5%
The weights should not be treated as universal.
Each retailer should adjust them according to its strategy and available data.
For example:
| Factor | Score | Weight | Weighted Score |
| Purchase Frequency | 5 | 20% | 1.00 |
| Price Awareness | 5 | 20% | 1.00 |
| Price Sensitivity | 5 | 20% | 1.00 |
| Competition | 5 | 15% | 0.75 |
| Sales Importance | 4 | 10% | 0.40 |
| Basket Influence | 4 | 10% | 0.40 |
| Store Choice | 4 | 5% | 0.20 |
| Total | 100% | 4.75 / 5 |
This product would be a strong KVI candidate.
- KVI Tiers
Not all KVIs have equal importance.
A useful approach is to create tiers.
Tier 1 — Critical KVIs
These are the products that strongly influence overall price perception.
Examples might include:
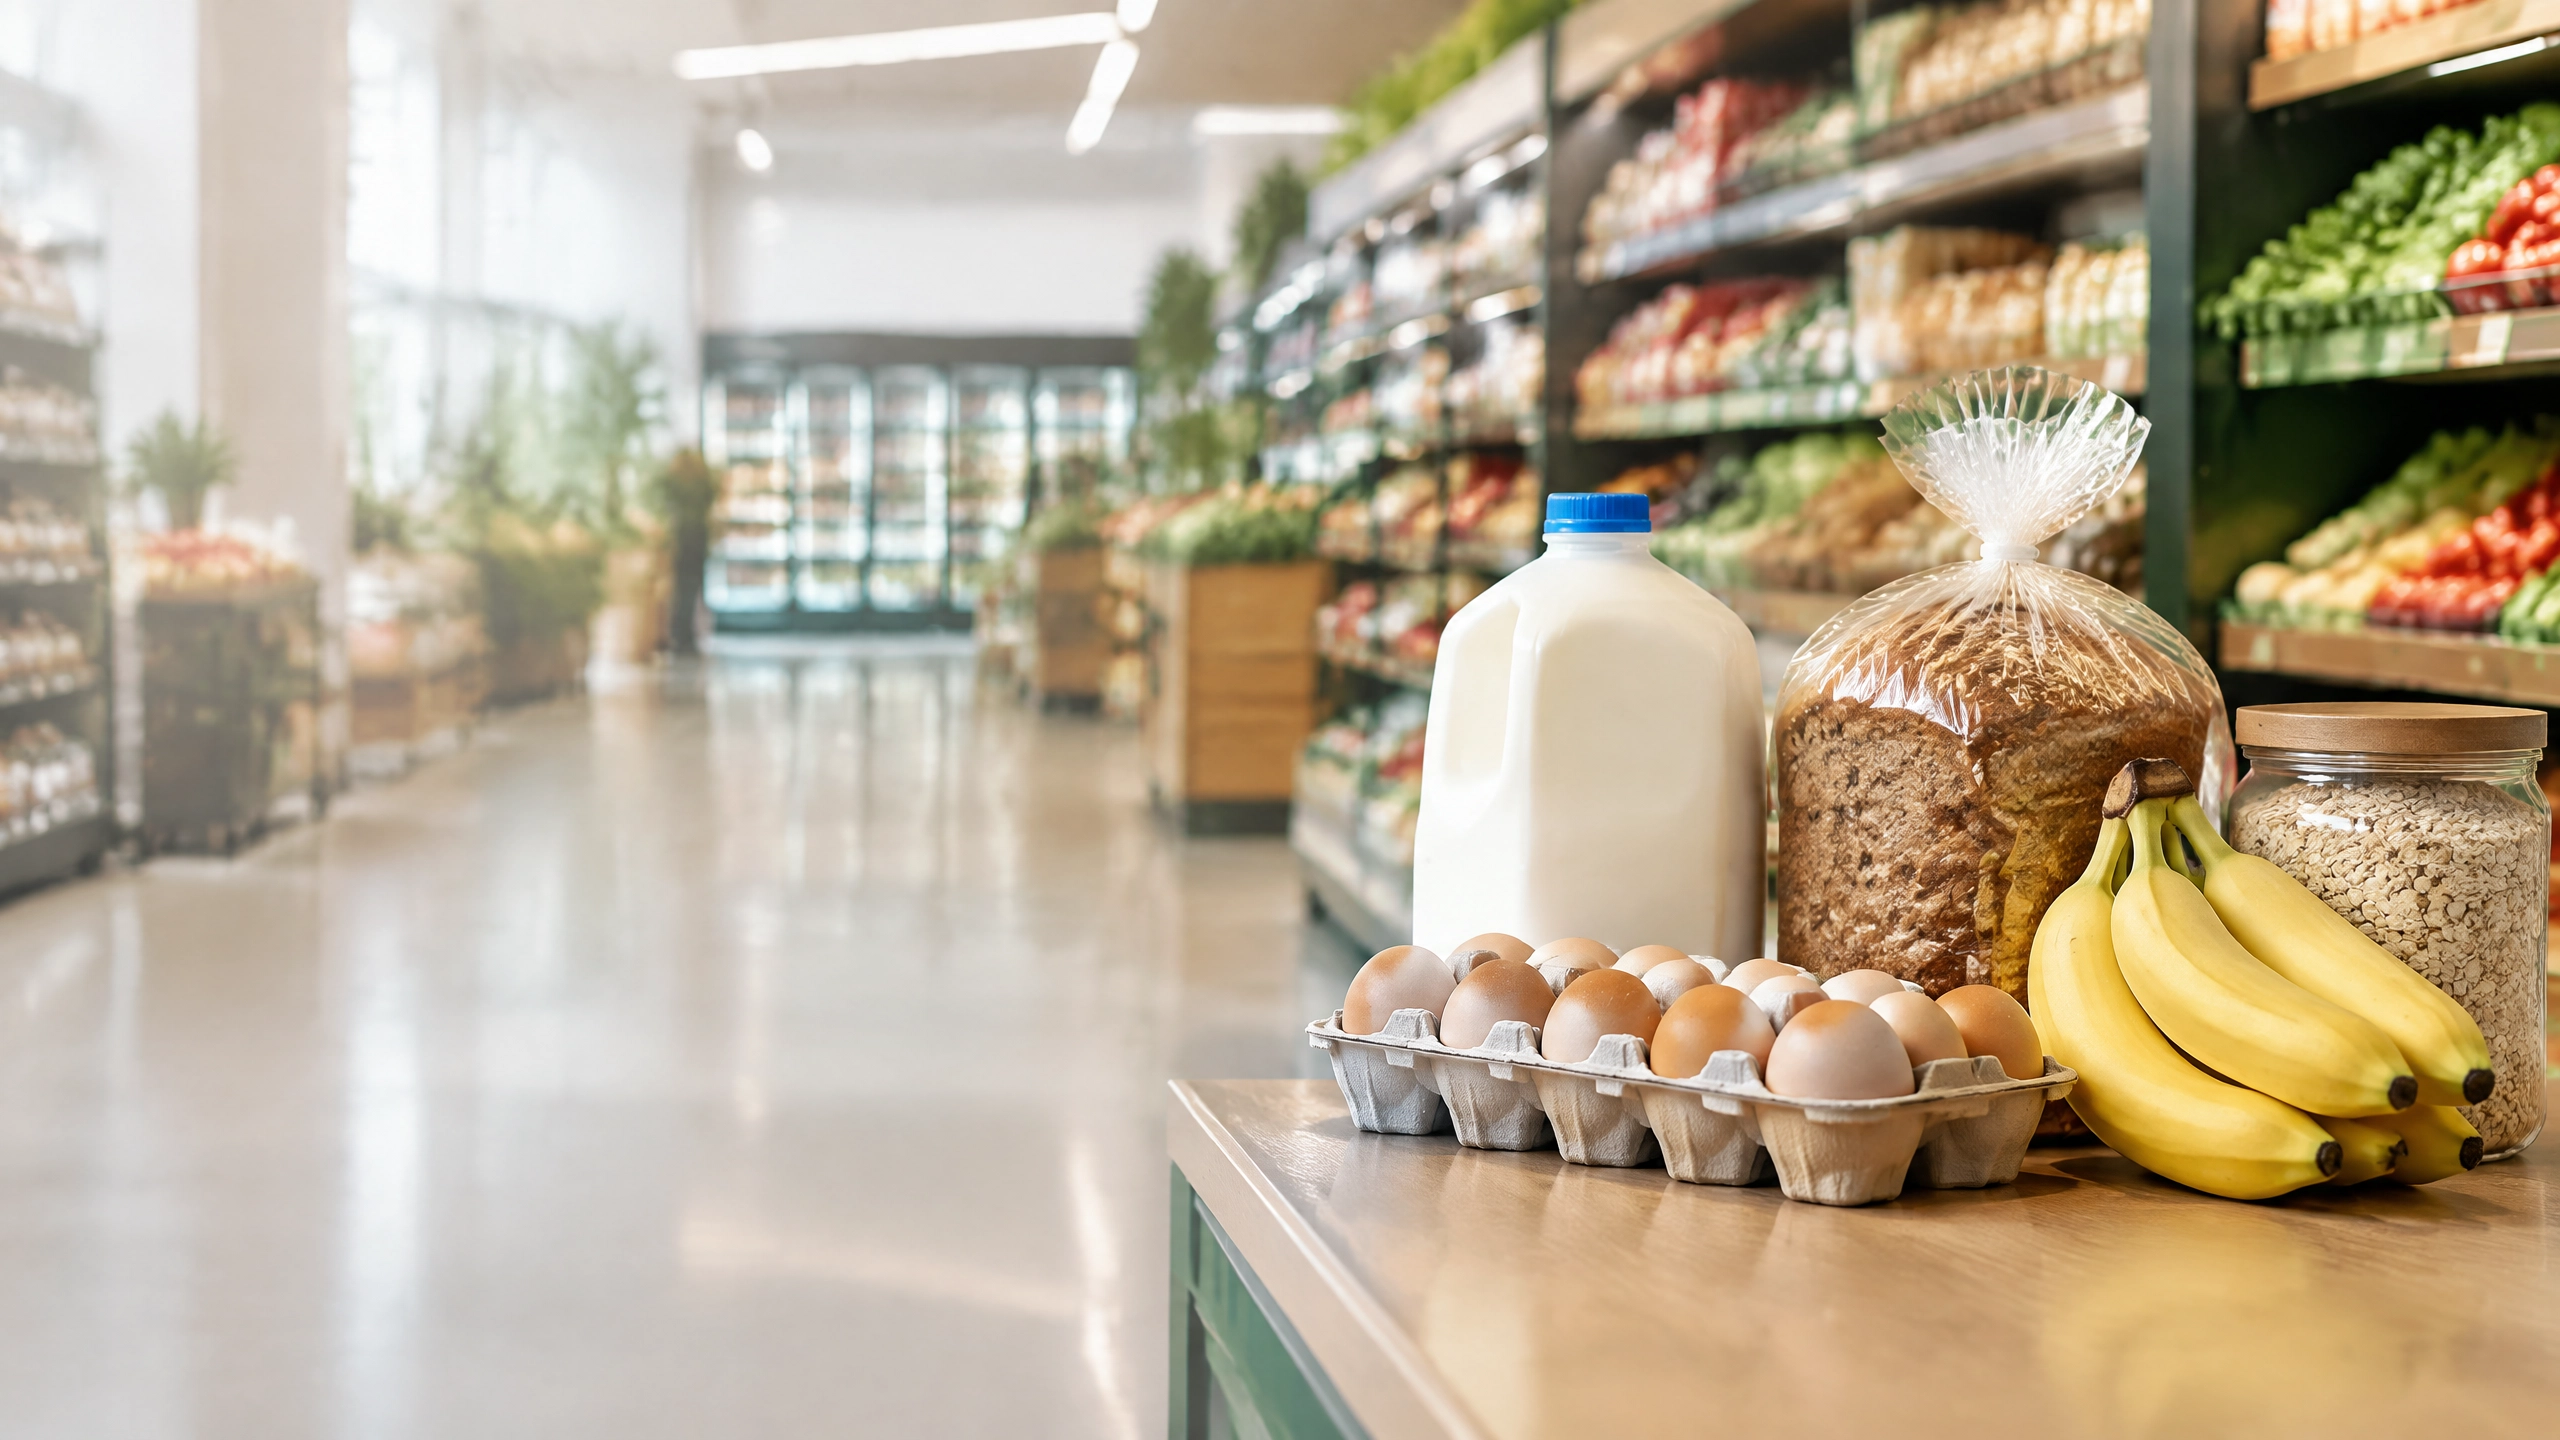
- Milk
- Eggs
- Rice
- Sugar
- Cooking oil
- Popular beverages
- Other frequently purchased staples
These products deserve the highest level of competitive monitoring.
Tier 2 — Important KVIs
These influence price perception within specific categories.
Examples:
- Yogurt
- Cheese
- Pasta
- Coffee
- Cereal
- Detergents
They may not define the entire store’s price image but can strongly influence category perception.
Tier 3 — Tactical KVIs
These may become important during specific periods.
Examples:
- Ramadan products
- Back-to-school products
- Christmas products
- Summer beverages
- Seasonal fresh products
Their KVI importance can change over time.
This is important:
KVI status is dynamic.
- KVI Identification Should Start With Customer Behavior
The strongest KVI models begin with actual customer behavior.
Useful data sources include:
- POS transactions
- Loyalty-card data
- Basket analysis
- Search data
- Customer surveys
- Competitor price data
- Promotion response
- Store traffic
- Product substitution behavior
For example, loyalty data may reveal that:
Product A
is purchased by 60% of weekly shoppers.
While:
Product B
is purchased by only 5%.
Even if Product B has a higher margin, Product A may have a much stronger influence on price perception.
- Customer Price Awareness
This is one of the most important—and often overlooked—KVI factors.
Ask:
“Does the customer actually know what this product costs?”
Customers are more likely to remember prices of products they buy frequently.
For example:
A shopper may know:
- Milk price
- Eggs price
- Bread price
- Rice price
- Bottled water price
But may have no idea what a specialized imported sauce costs.
Therefore:
Price Awareness × Purchase Frequency
can be a powerful KVI indicator.
- Competitive Comparability
A product becomes more important when customers can easily compare its price.
Consider:
Product A
A nationally recognized branded product available at:
- Supermarket A
- Supermarket B
- Supermarket C
- Online retailer
Comparison is easy.
Product B
A private-label specialty product available only at one retailer.
Comparison is difficult.
Therefore, Product A is more likely to be a KVI.
This is why branded, standardized and widely distributed products often have stronger KVI potential.
- Price Elasticity and KVI
KVI identification becomes even stronger when price elasticity is included.
Suppose two products both have high purchase frequency.
Product A
A 5% price increase causes demand to fall 10%.
Product B
A 5% price increase causes demand to fall only 1%.
Product A is much more price-sensitive.
If it is also highly visible and widely compared, its KVI score should increase.
This creates an important relationship:
High Price Awareness + High Price Sensitivity + High Competition = Strong KVI Candidate
- Basket Analysis
KVI identification should not stop at the product itself.
Ask:
What happens to the rest of the basket when this product is purchased?
Suppose:
Customers who buy milk also frequently buy:
- Bread
- Cheese
- Cereal
- Yogurt
Milk therefore has a significant basket influence.
A lower milk price might reduce milk margin but increase:
Total Basket Profit
This is a much more sophisticated way of evaluating the product.
- Store Choice Influence
Some products may influence the decision:
“Which supermarket should I visit today?”
For example, customers may choose a supermarket because they believe it offers competitive prices on:
- Fresh chicken
- Milk
- Baby products
- Coffee
- Water
- Household essentials
These products can become store-choice KVIs.
This is more powerful than simply looking at sales volume.
- The Difference Between KVI and Traffic Driver
These concepts are related but not identical.
KVI
Influences:
Price Perception
Traffic Driver
Influences:
Store Visits
A product can be:
- KVI only
- Traffic Driver only
- Both
- Neither
For example, a highly promoted seasonal product may generate traffic without strongly influencing the customer’s general perception of everyday prices.
Understanding this distinction prevents retailers from applying the same pricing logic to every traffic-generating product.
- KVI and Margin: The Critical Trade-Off
Here is the strategic dilemma.
Suppose:
Product A:
Cost = $2.00
Selling Price = $2.40
Margin = $0.40
Competitor:
$2.20
The retailer is 9% more expensive.
Management could reduce the price to:
$2.20
Margin becomes:
$0.20
The retailer loses $0.20 per unit.
Was that a bad decision?
Not necessarily.
If Product A is a powerful KVI, the price reduction may:
- Improve price perception
- Protect customer traffic
- Improve competitiveness
- Increase basket size
- Reduce customer switching
The correct question is therefore:
What is the total commercial impact of the price investment?
- KVI Price Investment
This leads to an important concept:
Price Investment
A retailer may intentionally accept lower margin on selected KVIs.
This should not be viewed simply as:
Margin Loss
It can be viewed as:
Customer Acquisition + Price Perception Investment
But the investment must be controlled.
For example:
| Metric | Before | After |
| KVI Margin | 18% | 14% |
| Store Traffic | 100 | 106 |
| Basket Value | $35 | $38 |
| Total Gross Profit | $100K | $112K |
If the overall economics improve, the lower KVI margin may be strategically justified.
- KVI Price Zones
Once KVIs are identified, retailers can define price zones.
For example:
Zone A — Price Leader
Retailer should be at or near the lowest competitive price.
Zone B — Price Competitive
Retailer can be slightly above the lowest price while maintaining strong competitiveness.
Zone C — Neutral
No need to invest aggressively.
Zone D — Margin Protection
Price can be higher where customer sensitivity is low.
This prevents the simplistic rule:
“All KVIs must always be the cheapest.”
That is not necessarily correct.
The objective is:
Optimal Price Positioning
—not automatic price leadership.
- Example: Building a KVI List for a Supermarket
Suppose a supermarket analyzes 5,000 SKUs.
After scoring:
Tier 1
250 SKUs
Critical KVIs
Tier 2
750 SKUs
Important KVIs
Tier 3
1,000 SKUs
Category/Situational KVIs
Non-KVI
3,000 SKUs
The retailer now has a manageable pricing structure.
Instead of monitoring 5,000 products equally, the pricing team can concentrate resources where they matter most.
- KVI Identification Using Data
A mature retailer can build an automated process.
Step 1
Extract SKU-level transaction data.
Step 2
Calculate purchase frequency.
Step 3
Calculate sales contribution.
Step 4
Estimate price elasticity.
Step 5
Measure competitor availability.
Step 6
Analyze customer price awareness.
Step 7
Analyze basket relationships.
Step 8
Measure store-choice influence.
Step 9
Calculate the KVI score.
Step 10
Assign the SKU to a KVI tier.
Step 11
Define pricing rules.
Step 12
Monitor performance continuously.
This turns KVI identification from a subjective merchandising exercise into a repeatable analytical process.
- How AI Can Improve KVI Identification
AI can significantly improve KVI analysis when sufficient data is available.
An AI model could analyze:
- Transaction frequency
- Customer segments
- Basket relationships
- Price changes
- Competitor prices
- Promotions
- Seasonality
- Substitution
- Search behavior
- Store traffic
- Customer feedback
The model can then identify patterns that may not be obvious to the pricing team.
For example:
“This product represents only 1.5% of sales but appears in 38% of baskets containing category X and is frequently compared with competitor Y.”
That product may deserve a higher KVI score than its sales contribution alone would suggest.
- Dynamic KVI Identification
KVI lists should not be static.
Customer behavior changes.
Competition changes.
Seasonality changes.
The economy changes.
Promotional behavior changes.
Therefore, a retailer should periodically recalculate KVI scores.
A practical frequency could be:
Weekly
Monitor major KVI price movements.
Monthly
Review KVI rankings and competitive gaps.
Quarterly
Rebuild the broader KVI model.
Seasonally
Identify temporary and event-driven KVIs.
This creates a:
Dynamic KVI Management System
rather than a static spreadsheet.
- Example: Ramadan KVI Shift
Imagine a supermarket in a market where Ramadan significantly changes purchasing patterns.
During normal months:
Milk may be a major KVI.
During Ramadan:
Additional products may become highly visible:
- Dates
- Sugar
- Rice
- Cooking oil
- Juice
- Tea
- Flour
- Traditional food ingredients
Some of these products may temporarily become much more important to price perception.
Therefore:
KVI = Customer Behavior × Market Context
not simply:
KVI = Historical Sales
- KVI Governance
A strong KVI system needs ownership.
A cross-functional team may include:
- Pricing
- Category Management
- Merchandising
- Marketing
- Finance
- Supply Chain
- Data Analytics
Each function contributes a different perspective.
Pricing
Competitive positioning.
Category Management
Category role.
Marketing
Customer perception.
Finance
Margin impact.
Supply Chain
Availability and inventory.
Analytics
Data and modeling.
This avoids creating a KVI list based on one department’s assumptions.
- The KVI Control Dashboard
A useful KVI dashboard could contain:
KVI Count
Number of active KVIs.
KVI Price Index
Price position against competitors.
KVI Availability
Percentage of KVIs in stock.
KVI Margin
Average gross margin.
KVI Price Gap
Difference from competitors.
KVI Elasticity
Average demand sensitivity.
KVI Sales Contribution
Share of total sales.
KVI Basket Contribution
Impact on total basket value.
KVI Traffic Impact
Relationship with store visits.
This turns KVI management into an ongoing performance process.
- Five Questions Every Retailer Should Ask
Before labeling a product as a KVI, ask:
1.
Do customers buy it frequently?
2.
Do customers know or remember its price?
3.
Can customers easily compare its price elsewhere?
4.
Does its price influence store or category perception?
5.
Does changing its price affect customer behavior or basket economics?
If the answer is “yes” to most of these questions, the product is a strong KVI candidate.
- The Most Important Principle
KVI identification is not about finding products that should always be cheap.
It is about finding products where pricing decisions have an outsized effect on customer perception and commercial performance.
This distinction is critical.
A KVI can justify:
- More frequent price monitoring
- More competitive pricing
- Lower margin
- More accurate competitor intelligence
- Faster price response
- Better promotion control
But none of these should happen automatically.
The ultimate objective is:
Optimal Price Perception + Sustainable Profitability
Conclusion
A supermarket may have tens of thousands of products.
But only a fraction of those products truly shape how customers perceive its prices.
Those products are the retailer’s Key Value Items.
The challenge is not simply identifying products with high sales.
The challenge is identifying the products that combine:
Customer Awareness + Purchase Frequency + Price Sensitivity + Competitive Comparability + Basket Influence + Store Choice Impact.
Once those products are identified, the retailer can stop treating every SKU equally.
Instead, it can deliberately decide:
- Where to invest in price
- Where to protect margin
- Where to monitor competitors closely
- Where to use promotions
- Where to maintain price stability
- Where to use AI and analytics
This creates a much more powerful pricing model:
Do not manage 20,000 prices equally. Manage the prices that matter most to the customer.
That is the strategic value of KVI identification.
Practical KVI Framework
A simple implementation sequence is:
- Collect Data
↓
- Segment Products
↓
- Score KVI Factors
↓
- Rank Products
↓
- Create KVI Tiers
↓
- Set Price Rules
↓
- Monitor Competitors
↓
- Measure Customer & Margin Impact
↓
- Recalculate KVI Scores
↓
- Continuously Improve
The result is not simply a KVI list.
It is a KVI Management System that connects customer behavior, competitive pricing, category strategy and profitability.
Related Articles
https://opexedg.com/post/grocery-retail-pricing-strategy/
https://opexedg.com/post/kvi-identification-grocery-retail/
https://opexedg.com/post/grocery-price-elasticity/
https://opexedg.com/post/competitive-pricing-grocery-retail/
https://opexedg.com/post/promotion-effectiveness-grocery-retail/
https://opexedg.com/post/ai-powered-retail-pricing/
