
Introduction
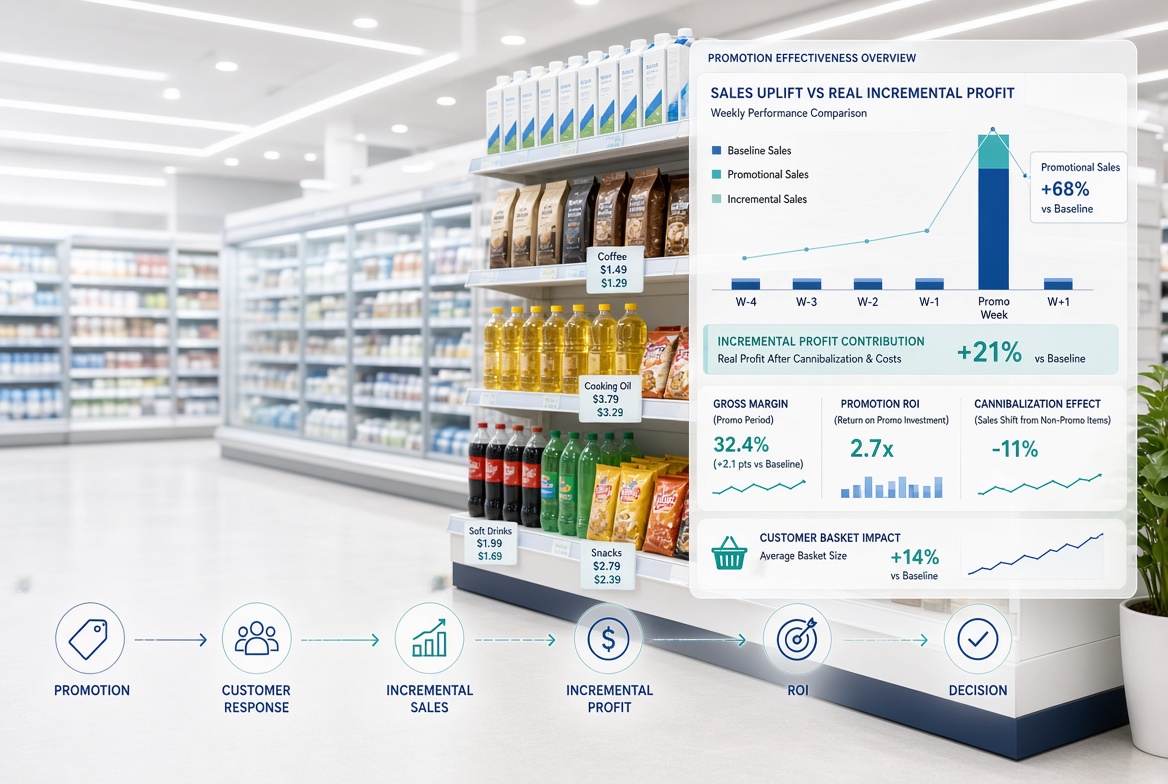
Promotions are among the most powerful—and most misunderstood—tools in grocery retail.
A temporary price reduction can increase traffic, accelerate sales, clear inventory, encourage trial, increase basket size, defend market share, or strengthen customer loyalty.
But higher sales during a promotion do not automatically mean the promotion was successful.
A product may sell 40% more units while generating less profit.
A promotion may attract customers who would have purchased the product anyway.
A discount on one SKU may simply steal sales from another SKU in the same category.
Customers may buy additional units during the promotion and then purchase less in subsequent weeks.
Or the retailer may generate strong demand that cannot be fulfilled because inventory runs out.
The real question is therefore not:
“How much did sales increase?”
It is:
“How much incremental, profitable business did the promotion create?”
This distinction transforms promotion management from a merchandising activity into a measurable commercial discipline.
A modern grocery retailer should evaluate promotions through four dimensions:
Incremental Sales + Incremental Margin + Customer Impact + Strategic Impact
This article presents a practical framework for measuring promotion effectiveness, identifying promotional waste, understanding customer response, and building a more intelligent promotion system.
-
What Is Promotion Effectiveness?
Promotion effectiveness is the degree to which a promotion achieves its intended commercial objective relative to the investment required to run it.
A promotion can have several objectives:
- Increase unit sales
- Increase revenue
- Increase gross margin
- Increase store traffic
- Increase basket size
- Acquire new customers
- Increase purchase frequency
- Introduce a new product
- Defend market share
- Reduce excess inventory
- Improve category performance
- Support seasonal demand
- Increase customer loyalty
Therefore, there is no single KPI that determines whether a promotion succeeded.
For example:
| Promotion Objective | Primary KPI |
| Increase volume | Incremental units |
| Increase revenue | Incremental revenue |
| Protect profit | Incremental gross margin |
| Increase basket | Incremental basket value |
| Acquire customers | New customer rate |
| Drive traffic | Incremental transactions |
| Clear inventory | Stock reduction |
| Increase loyalty | Repeat purchase rate |
| Defend market position | Relative market performance |
The first principle is simple:
A promotion should be evaluated against its objective, not simply against its sales uplift.
2. Promotion Sales Are Not the Same as Incremental Sales
This is one of the most important concepts in promotion analytics.
Suppose a supermarket normally sells:
1,000 units per week
During a promotion it sells:
1,500 units
The retailer might report:
+50% sales uplift
But what actually happened?
The additional 500 units could include:
- Customers buying earlier than planned
- Customers buying more than they normally would
- Customers switching from competitors
- Customers switching from another SKU
- Customers purchasing because of the discount
- Customers who would have purchased at full price anyway
Only part of the additional volume may represent genuine incremental demand.
The objective is therefore to estimate:
Incremental Units
Incremental Units = Promotional Units − Baseline Units
If:
- Promotional sales = 1,500
- Baseline sales = 1,000
Then:
Incremental Units = 500
But this is only the starting point.
The next question is:
How much of that 500 units was truly caused by the promotion?
That requires a reliable baseline.
3. Establishing the Promotional Baseline
A baseline represents what sales would probably have been without the promotion.
This sounds simple but is one of the most difficult parts of promotion measurement.
A weak baseline can make a bad promotion look successful—or make a successful promotion look weak.
Common baseline approaches
3.1 Historical Average
Use average sales from comparable non-promotional periods.
For example:
| Week | Units |
| Week -4 | 980 |
| Week -3 | 1,020 |
| Week -2 | 1,010 |
| Week -1 | 990 |
| Average | 1,000 |
Promotion week:
1,500 units
Estimated uplift:
50%
This method is simple but can be misleading when seasonality, price changes, holidays, or availability have changed.
4. Adjust the Baseline for Seasonality
Grocery demand is highly seasonal.
Ramadan, Eid, Christmas, summer, school opening, holidays, weather, weekends, and local events can materially change demand.
Suppose normal weekly sales are:
1,000 units
But historical sales during the same Ramadan week are:
1,250 units
If the promotion generates:
1,500 units
Comparing 1,500 with the ordinary 1,000 baseline would suggest:
+50% uplift
But the more realistic comparison is:
1,500 − 1,250 = 250 incremental units
or:
+20% incremental uplift
This is why promotion evaluation must distinguish between:
Promotion Effect
and
Calendar Effect
5. Incremental Sales vs. Incremental Profit
One of the most common retail mistakes is evaluating promotions using sales growth alone.
Consider a product with:
- Regular price = $5.00
- Cost = $3.00
- Normal weekly volume = 1,000 units
Normal gross profit:
($5 − $3) × 1,000 = $2,000
Now suppose the retailer offers a 20% discount.
Promotional price:
$4.00
Volume increases to:
1,500 units
Promotional gross profit:
($4 − $3) × 1,500 = $1,500
Sales volume increased:
+50%
But gross profit decreased:
$2,000 → $1,500
The promotion generated more units but destroyed $500 of gross profit.
This demonstrates a fundamental principle:
Sales uplift does not equal economic success.
6. The Incremental Gross Margin Test
A better promotional KPI is:
Incremental Gross Margin
Incremental Gross Margin = Promotional Gross Margin − Baseline Gross Margin
Using the previous example:
Baseline gross margin:
$2,000
Promotional gross margin:
$1,500
Therefore:
Incremental Gross Margin = −$500
The promotion failed financially.
However, this calculation can still be incomplete because a promotion can generate incremental sales in other products.
For example, customers attracted by the promoted milk may also buy:
- Bread
- Eggs
- Cheese
- Cereal
- Coffee
This creates the concept of:
Total Basket Impact
7. Measure the Whole Basket, Not Only the Promoted SKU
A promotion can affect the customer’s entire shopping mission.
Suppose a supermarket discounts a popular coffee brand.
Before promotion:
- Coffee sales = $10
- Average basket = $42
During promotion:
- Coffee sales = $8
- Average basket = $48
The coffee promotion appears to reduce revenue on the promoted product.
But the customer is spending:
$6 more on the total basket.
If the promotion attracts additional shopping trips or increases complementary purchases, the retailer may still benefit.
This is why promotion evaluation should consider:
SKU → Category → Basket → Customer
rather than evaluating the promoted product in isolation.
8. Cannibalization: The Hidden Cost of Promotions
Cannibalization occurs when promotional sales come at the expense of another product.
For example, a retailer promotes:
Brand A Coffee: $5 → $4
Sales increase by 600 units.
At first glance, this appears successful.
But Brand B sales fall by:
400 units
If customers simply switched between the two brands, the retailer may have created much less incremental category demand than the SKU-level report suggests.
Example
| Metric | Before | Promotion |
| Brand A | 1,000 | 1,600 |
| Brand B | 1,200 | 800 |
| Category Total | 2,200 | 2,400 |
Brand A:
+600 units
Brand B:
−400 units
Category:
+200 units
The SKU report shows a 60% increase.
The category report shows only:
9.1% growth
This is why promotion effectiveness must include category-level measurement.
9. Cross-Price Effects
Cannibalization is closely related to cross-price elasticity.
When the price of Product A decreases, demand for Product B may:
- Decrease because customers substitute toward A
- Increase because A complements B
- Remain almost unchanged
For example:
Substitute
Discounted premium yogurt may reduce sales of another yogurt brand.
Complement
A promotion on pasta may increase sales of pasta sauce.
Independent
A discount on laundry detergent may have little effect on bottled water.
Understanding these relationships helps retailers determine whether promotions create:
Substitution
or
True incremental demand
or
Complementary basket growth
10. Promotion Depth Matters
Not every discount creates the same customer response.
Suppose a product normally sells for $10.
The retailer tests:
- 5% discount
- 10% discount
- 20% discount
- 30% discount
The objective is not necessarily to find the largest volume increase.
Instead, the retailer should identify the point where:
Incremental Profit = Maximum
A deeper discount may produce more volume but substantially lower margin.
This creates a promotion optimization problem:
What is the minimum discount required to generate the desired customer response?
11. Promotion Elasticity
Promotion elasticity measures how strongly demand responds to promotional intensity.
A simple conceptual measure is:
Promotion Elasticity = % Change in Quantity / % Change in Effective Price
For example:
Price falls by:
10%
Quantity increases by:
25%
Promotion response:
25% ÷ −10% = −2.5
The negative sign reflects the inverse relationship between price and demand.
The absolute value indicates a strong response.
But promotion elasticity should not be interpreted in isolation.
The retailer must also consider:
- Margin
- Competition
- Stock availability
- Promotion frequency
- Customer stock-up
- Cannibalization
- Basket effect
- Post-promotion demand
12. The Stock-Up Effect
Promotions can create demand that appears incremental in the short term but simply shifts future purchases forward.
Suppose a customer normally buys:
1 bottle per week
During a promotion, the customer buys:
4 bottles
The retailer may report:
+300% sales uplift
But the customer may not buy the product for the next three weeks.
Total four-week demand may therefore be unchanged.
Without promotion
1 + 1 + 1 + 1 = 4 units
With promotion
4 + 0 + 0 + 0 = 4 units
The promotion created:
Timing change
rather than:
Incremental demand
This is particularly important for:
- Household products
- Personal care
- Non-perishables
- Beverages
- Packaged grocery products
13. Post-Promotion Dip
The opposite problem is the post-promotion sales decline.
A promotion can temporarily increase sales and then produce a demand trough afterward.
Example:
| Period | Units |
| Normal | 1,000 |
| Promotion | 1,700 |
| Week +1 | 700 |
| Week +2 | 850 |
| Week +3 | 950 |
Looking only at the promotion week produces a misleading conclusion.
A better evaluation window might include:
Pre-Promotion + Promotion + Post-Promotion
This allows the retailer to determine whether the promotion generated:
- Genuine incremental demand
- Demand shifting
- Stock-up
- Customer switching
- Post-promotion demand destruction
14. Promotion Frequency Can Train Customers to Wait
Frequent promotions can unintentionally change customer behavior.
Imagine a product with:
Regular price = $10
but it is promoted every two weeks at:
$8
Customers may gradually stop buying at $10.
The retailer has effectively created:
$8 = perceived normal price
The $10 price becomes psychologically unacceptable.
This can damage:
- Price perception
- Full-price sales
- Gross margin
- Promotional effectiveness
- Brand positioning
Therefore:
A promotion is not only a short-term pricing decision. It can change future customer reference prices.
15. Promotion Depth × Frequency
Retailers should analyze both:
How deep?
and
How often?
A 20% promotion once per quarter may have a very different effect from a 20% promotion every two weeks.
A useful management matrix is:
| Discount Depth | Frequency | Risk |
| Low | Low | Low |
| High | Low | Moderate |
| Low | High | Moderate |
| High | High | High |
High-depth/high-frequency promotions deserve particular scrutiny because they can create dependency on discounts.
16. Promotion ROI
A practical promotion ROI calculation should compare incremental profit with the investment required.
Conceptually:
Promotion ROI = Incremental Profit / Promotion Investment
Promotion investment may include:
- Discount funding
- Supplier funding
- Advertising
- Display fees
- Digital media
- Coupon cost
- Loyalty points
- Store execution
- Additional labor
- Logistics
- Markdown losses
For example:
Incremental profit:
$8,000
Promotion investment:
$2,000
Promotion ROI:
4.0×
However, retailers should define the denominator consistently.
Otherwise, two promotions can appear comparable when their underlying costs are very different.
17. Supplier-Funded Promotions
Supplier funding can materially change promotion economics.
Suppose:
Regular price = $5
Supplier cost = $3
The retailer normally earns:
$2 per unit
During promotion:
Retail price = $4
Without supplier support:
$4 − $3 = $1 margin
But suppose the supplier contributes:
$0.50 per promoted unit
Effective margin becomes:
$1.50
This can transform a marginal promotion into an economically attractive one.
Therefore, promotion evaluation should distinguish between:
Retailer-funded discount
and
Supplier-funded discount
and calculate the economics of both.
18. Promotion Types Should Be Evaluated Differently
Not every promotion should use the same success criteria.
Price Discount
Primary metrics:
- Incremental units
- Incremental margin
- Price elasticity
- ROI
Buy One Get One
Primary metrics:
- Incremental units
- Margin per transaction
- Stock-up effect
- Basket impact
Multi-Buy
Example:
2 for $X
Evaluate:
- Units per transaction
- Basket value
- Incremental margin
- Customer stock-up
Coupon
Evaluate:
- Redemption
- Incremental purchase
- Customer acquisition
- Repeat purchase
Loyalty Promotion
Evaluate:
- Member participation
- Frequency
- Retention
- Customer lifetime value
Display Promotion
Evaluate:
- Incremental sales
- Traffic
- Conversion
- Category uplift
19. Promotion Effectiveness by Customer Segment
Not every customer responds equally.
Consider three customers:
Customer A — Highly Price Sensitive
Buys only during promotions.
Customer B — Loyal Brand Buyer
Buys the same brand regardless of price.
Customer C — Mission Shopper
Responds to a promotion only when the product is part of a planned shopping mission.
A promotion targeting all three customers equally may waste margin on Customer B while failing to influence Customer A enough.
Therefore, retailers can improve promotion efficiency by analyzing:
- Customer segment
- Purchase frequency
- Historical promotion response
- Basket composition
- Loyalty
- Price sensitivity
- Brand preference
This creates the foundation for personalized promotion.
20. Promotion Affinity
Some customers are naturally more promotion-sensitive than others.
A useful metric is:
Promotion Affinity = Promotional Purchase Rate / Normal Purchase Rate
A high-affinity customer may respond strongly to:
- Coupons
- Loyalty offers
- Multi-buy
- Digital promotions
- Personalized discounts
A low-affinity customer may purchase regardless of promotion.
This distinction helps retailers avoid giving discounts to customers who did not need an incentive.
21. The Difference Between Sales Uplift and Incremental Sales
Retailers should separate three concepts:
Sales Uplift
How much sales increased during the promotion.
Incremental Sales
How much sales increased beyond the expected baseline.
Incremental Profit
How much additional profit remained after considering discount and promotion costs.
These are not interchangeable.
A promotion can have:
High uplift + Low incremental sales + Negative incremental profit
and therefore be commercially unsuccessful.
22. Promotion Effectiveness Scorecard
A practical promotion dashboard can include:
| KPI | Purpose |
| Promotional Units | Measure observed volume |
| Baseline Units | Estimate expected demand |
| Incremental Units | Measure true uplift |
| Incremental Revenue | Measure additional sales value |
| Gross Margin | Measure profitability |
| Incremental Gross Margin | Measure economic contribution |
| Discount % | Measure price investment |
| Promotion ROI | Measure efficiency |
| Category Uplift | Detect cannibalization |
| Basket Uplift | Measure broader customer impact |
| New Customers | Measure acquisition |
| Repeat Rate | Measure long-term value |
| Stock-Out Rate | Detect lost promotional demand |
| Post-Promotion Dip | Detect demand shifting |
| Supplier Funding | Measure external support |
The objective is not to create a dashboard containing dozens of numbers.
The objective is to answer:
Did this promotion create profitable incremental value?
23. The Promotion Effectiveness Matrix
A simple management framework can classify promotions according to incremental sales and incremental profit.
| High Incremental Profit | Low/Negative Incremental Profit | |
| High Incremental Sales | Scale | Redesign |
| Low Incremental Sales | Optimize | Stop |
Scale
Strong sales and strong profit.
Redesign
Customers respond, but economics are weak.
Possible actions:
- Reduce discount depth
- Change mechanic
- Improve supplier funding
- Change promoted SKU
- Reduce frequency
Optimize
Profit exists but customer response is limited.
Possible actions:
- Improve targeting
- Increase visibility
- Adjust timing
- Change customer segment
Stop
The promotion creates neither meaningful demand nor profit.
24. A Practical Example
Consider a supermarket promoting a detergent brand.
Before Promotion
Price:
$12
Cost:
$7
Weekly volume:
1,000 units
Gross profit:
$5,000
During Promotion
Price:
$9
Volume:
1,700 units
Gross profit:
$3,400
At SKU level:
Units: +70%
But gross profit:
−32%
The promotion appears successful from a sales perspective but unsuccessful from a margin perspective.
Now suppose category sales were:
Before:
5,000 units
During:
5,400 units
The promoted SKU gained:
700 units
but the category gained only:
400 units
Therefore:
300 units were effectively cannibalized from other products.
Now add basket impact.
Average basket before:
$45
Average basket during:
$51
If the promotion generated additional customer traffic and complementary purchases, the retailer may recover part of the margin investment.
The final decision therefore requires a complete commercial view.
25. Promotion Evaluation Should Start Before the Promotion
One of the biggest opportunities in retail is to stop treating promotion analysis as a post-event report.
Before launching a promotion, retailers should estimate:
Expected Baseline
What would happen without promotion?
Expected Uplift
How much additional demand is expected?
Expected Margin
How much profit should remain?
Cannibalization
Which products may lose sales?
Stock-Up
Will customers purchase future demand early?
Basket Effect
What complementary products may benefit?
Competitive Response
Will competitors react?
Inventory Capacity
Can the retailer fulfill the expected demand?
Post-Promotion Effect
Could demand fall afterward?
This creates a Promotion Business Case before the promotion is approved.
26. Promotion Forecasting
Promotion forecasting should combine multiple variables rather than simply applying a historical uplift percentage.
A conceptual model can be expressed as:
Demand = f(Price, Promotion, Competition, Seasonality, Availability, Store, Customer, Product)
Important variables include:
- Regular price
- Promotional price
- Discount depth
- Promotion type
- Display
- Advertising
- Competitor price
- Season
- Day of week
- Store
- Customer segment
- Product category
- Historical promotion response
- Inventory availability
This allows the retailer to move from:
“What happened last time?”
to:
“What is likely to happen under this promotion scenario?”
27. AI-Powered Promotion Optimization
Artificial intelligence can significantly improve promotion management when sufficient historical data exists.
An AI-enabled promotion system can analyze:
- Historical promotions
- Price elasticity
- Customer response
- Competitor prices
- Seasonal patterns
- Product relationships
- Cannibalization
- Basket behavior
- Store differences
- Promotion frequency
- Supplier funding
- Inventory constraints
It can then simulate scenarios such as:
10% discount → expected volume +12%
15% discount → expected volume +20%
20% discount → expected volume +25%
The retailer can compare the expected incremental profit of each scenario.
The goal is not:
Maximum promotional sales
but:
Maximum profitable incremental demand.
28. From Promotion Calendar to Promotion Portfolio
Many retailers manage promotions as a calendar:
Week 1 → Promotion A
Week 2 → Promotion B
Week 3 → Promotion C
A more mature retailer manages promotions as a portfolio.
Each promotion should have:
- Objective
- Target customer
- Target category
- Expected uplift
- Expected margin
- Funding
- Risk
- KPI
- Post-promotion evaluation
The question becomes:
What is the expected return of the entire promotional portfolio?
This allows management to allocate promotional investment toward the highest-value opportunities.
29. Common Promotion Mistakes
Mistake 1: Measuring only sales uplift
Sales can increase while profit decreases.
Mistake 2: Using an incorrect baseline
Seasonality and market changes can distort the result.
Mistake 3: Ignoring cannibalization
SKU growth does not necessarily mean category growth.
Mistake 4: Ignoring stock-up
Customers may simply purchase future demand earlier.
Mistake 5: Ignoring post-promotion sales
A promotion may create a temporary spike followed by a decline.
Mistake 6: Giving discounts to loyal customers
Some customers would have purchased without the promotion.
Mistake 7: Ignoring inventory availability
A stock-out can make a highly effective promotion appear weak.
Mistake 8: Evaluating all promotions using one KPI
Different objectives require different measures.
Mistake 9: Optimizing volume instead of profit
More units do not automatically create more value.
Mistake 10: Repeating promotions because they worked once
Market conditions, competitors and customer behavior change.
30. The Promotion Effectiveness Operating Model
A mature promotion process can follow:
- Define Objective
What is the promotion supposed to achieve?
↓
- Select Product
Which SKU/category should be promoted?
↓
- Estimate Baseline
What would happen without promotion?
↓
- Estimate Elasticity
How much demand response should be expected?
↓
- Estimate Cannibalization
Which products may lose demand?
↓
- Estimate Basket Effect
What complementary sales may be generated?
↓
- Calculate Economics
What is the expected incremental profit?
↓
- Check Inventory
Can the retailer fulfill expected demand?
↓
- Launch
Execute the promotion.
↓
- Measure
Compare actual vs. expected.
↓
- Evaluate
Calculate incremental sales and profit.
↓
- Learn
Update future promotion assumptions.
This creates a continuous learning loop:
Plan → Promote → Measure → Learn → Improve
31. Promotion Effectiveness and the Pricing Strategy System
Promotion effectiveness should not operate independently from pricing.
The complete grocery pricing system connects:
Pricing Strategy
↓
KVI Identification
↓
Price Elasticity
↓
Promotion Strategy
↓
Competitive Pricing
↓
AI Price & Promotion Optimization
Each component answers a different question.
| Component | Key Question |
| Pricing Strategy | What should our overall price position be? |
| KVI | Which products shape customer price perception? |
| Elasticity | How will customers respond to price changes? |
| Promotion Effectiveness | Did the promotion create profitable incremental demand? |
| Competitive Pricing | How should we respond to competitors? |
| AI Optimization | What price/promotion combination should we choose? |
This integrated approach is far more powerful than managing price and promotions separately.
32. The OpexEdge Promotion Effectiveness Framework
A practical framework can be summarized as:
PROMOTION
P — Purpose
Define the commercial objective.
R — Reference Baseline
Estimate expected demand without promotion.
O — Offer Economics
Calculate discount, margin and funding.
M — Market Response
Measure customer and competitor reaction.
O — Opportunity Impact
Measure category and basket effects.
T — Timing & Stock-Up
Evaluate seasonality and demand shifting.
I — Incremental Profit
Measure true economic contribution.
O — Optimization
Improve future promotions using data.
N — Next Learning Cycle
Feed the results into future decisions.
The framework moves promotion management from:
Discount → Sales Spike
to:
Objective → Baseline → Response → Incrementality → Profit → Learning
Conclusion
Promotions are not inherently profitable.
They are investments.
A retailer gives up some price in exchange for an expected customer response. The quality of that investment depends on whether the response creates enough incremental value to justify the cost.
The most important distinction is therefore:
Promotional sales are not necessarily incremental sales, and incremental sales are not necessarily incremental profit.
Effective promotion management requires retailers to understand:
- Baseline demand
- Incremental sales
- Price response
- Cannibalization
- Basket impact
- Stock-up behavior
- Post-promotion effects
- Supplier funding
- Customer segmentation
- Promotion ROI
- Inventory availability
The most mature retailers do not ask:
“How much did we sell during the promotion?”
They ask:
“What would have happened without the promotion, what did the promotion actually change, and how much profitable value did it create?”
That is the difference between running promotions and managing promotions strategically.
Related Articles
https://opexedg.com/post/grocery-retail-pricing-strategy/
https://opexedg.com/post/kvi-identification-grocery-retail/
https://opexedg.com/post/grocery-price-elasticity/
https://opexedg.com/post/competitive-pricing-grocery-retail/
https://opexedg.com/post/promotion-effectiveness-grocery-retail/
https://opexedg.com/post/ai-powered-retail-pricing/
