
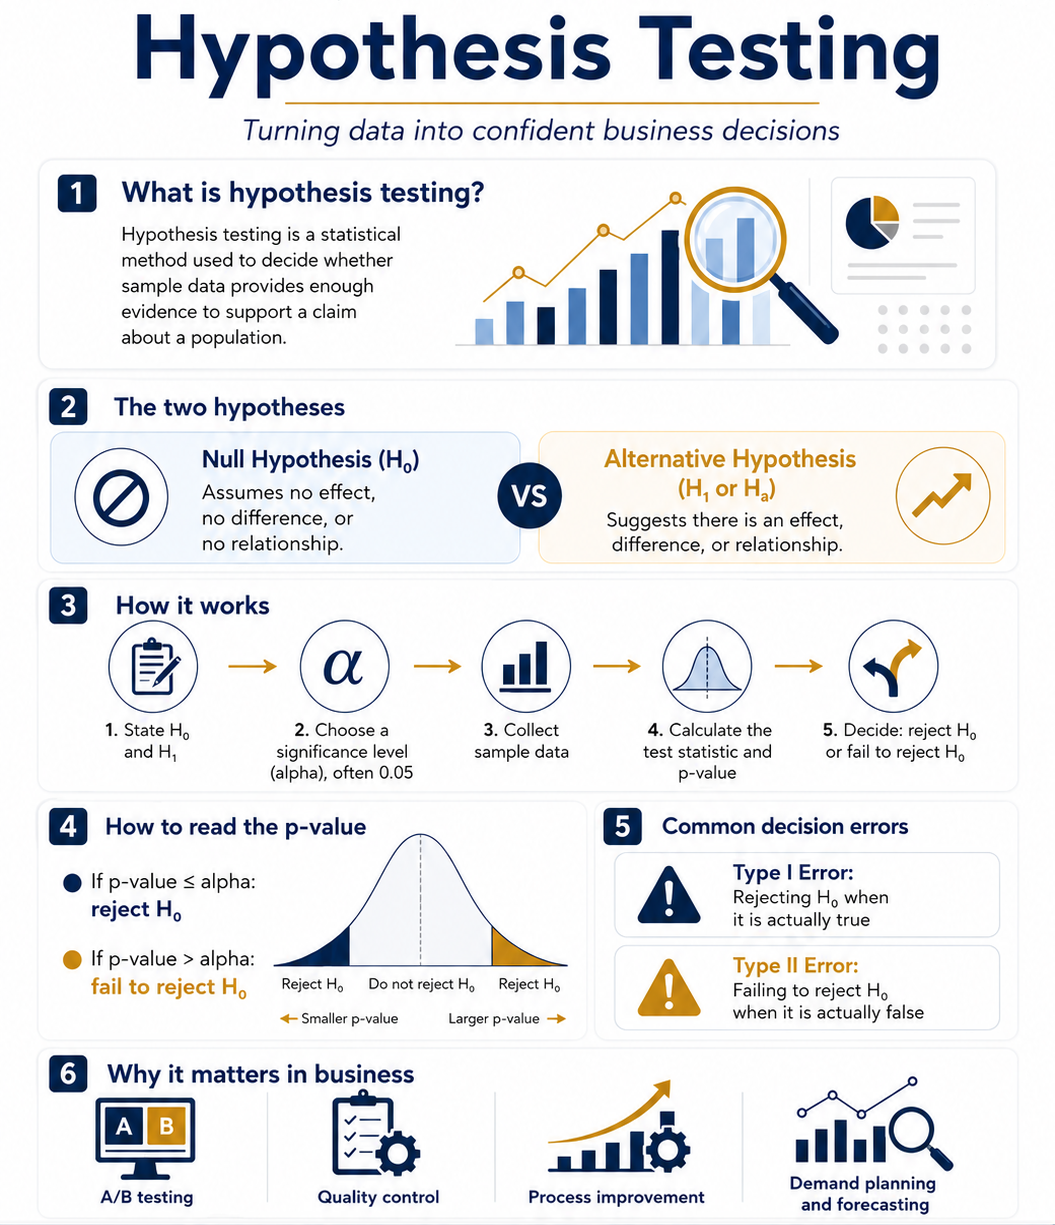
Hypothesis testing is a statistical method used to decide whether there is enough evidence in a sample to support a claim about a population.
Main idea
You start with two competing statements:
- Null hypothesis (H0)(H_0)(H0): usually says there is no effect, no difference, or no relationship.
- Alternative hypothesis (H1 or Ha)(H_1 \text{ or } H_a)(H1 or Ha): says there is an effect, difference, or relationship.
Example
Suppose a company claims that the average battery life of its product is 10 hours.
- H0: μ=10H_0:\ \mu = 10H0: μ=10
- H1: μ≠10H_1:\ \mu \neq 10H1: μ=10
You test a sample of batteries. If the results are very unlikely to happen when the average is truly 10 hours, you reject the null hypothesis.
Basic steps
- State H0H_0H0 and H1H_1H1.
-
Choose a significance level, usually:
α=0.05\alpha = 0.05α=0.05 - Collect sample data.
- Calculate a test statistic and a p-value.
- Compare the p-value with α\alphaα.
Decision rule:
- If p-value ≤α\leq \alpha≤α: reject H0H_0H0.
- If p-value >α> \alpha>α: fail to reject H0H_0H0.
Important wording
You usually say “fail to reject the null hypothesis”, not “accept the null hypothesis,” because the test may not prove that H0H_0H0 is true. It only shows whether the evidence against it is strong enough.
Types of errors
| Error | Meaning |
|---|---|
| Type I error | Rejecting H0H_0H0 when it is actually true |
| Type II error | Failing to reject H0H_0H0 when it is actually false |
Common hypothesis tests
| Test | Used for |
|---|---|
| t-test | Comparing averages |
| z-test | Testing averages or proportions with large samples |
| Chi-square test | Testing relationships between categorical variables |
| ANOVA | Comparing three or more averages |
| Correlation test | Checking whether two variables are related |
In simple words, hypothesis testing helps you decide whether an observed result is likely a real effect or could have happened by random chance.

15 Comments