
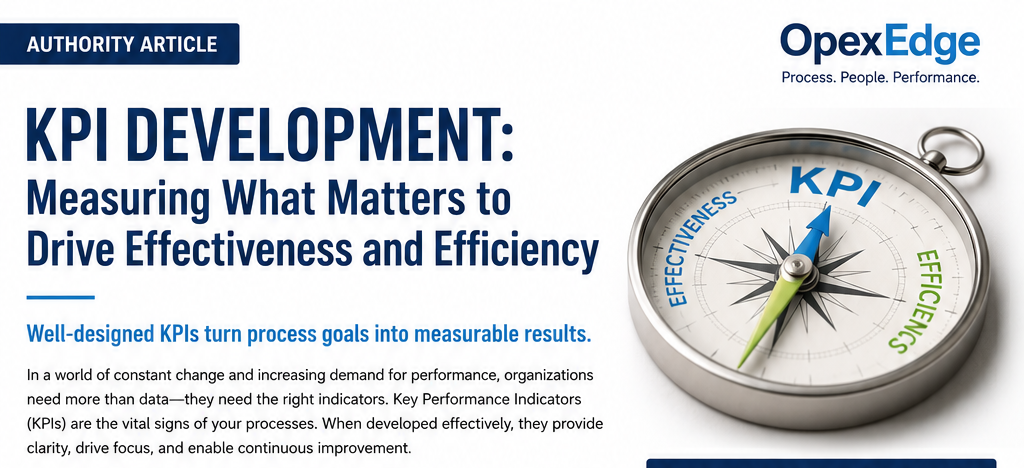
KPI Development: Measuring
What Matters to Improve Effectiveness and Efficiency
Most
organizations do not fail because they have no data.
They fail because they measure too many things, measure the wrong things, or
measure results without converting them into action.
Key
Performance Indicators, commonly known as KPIs, are not just dashboard numbers.
They are management tools that help organizations understand whether their
processes are delivering the right outcomes, using resources wisely, and moving
the business closer to its strategic objectives.
A
well-developed KPI system answers two critical questions:
Are
we effective?
Are we achieving the right results?
Are
we efficient?
Are we achieving those results with the best use of time, cost, people,
materials, and capacity?
When
KPIs measure both effectiveness and efficiency, they become a powerful
foundation for operational excellence, continuous improvement, ISO 9001
performance evaluation, lean management, customer satisfaction, and business
growth.
What Is KPI Development?
KPI development is the structured
process of defining, designing, measuring, reviewing, and improving performance
indicators for a business process, department, service, or organization.
A KPI should not be selected
simply because it is easy to measure. It should be selected because it reflects
something important to business performance.
A strong KPI connects four
elements:
1.
Business objective
2.
Process output
3.
Customer expectation
4.
Improvement action
For example, if a company wants to
improve customer delivery performance, the KPI should not only count how many
orders were shipped. It should measure whether orders were delivered complete,
on time, and according to customer requirements.
This is the difference between a
normal metric and a meaningful KPI.
A metric tells you what happened.
A KPI tells you whether what happened matters.
Why KPI Development Matters
Without clear KPIs, managers
depend on opinions, assumptions, and delayed reactions. Problems are often
discovered after customer complaints, financial losses, delivery failures, or
operational disruptions.
With well-designed KPIs,
organizations can detect performance gaps earlier, prioritize improvement
efforts, and make decisions based on facts.
Effective KPI development
helps organizations to:
·
Translate strategy into
measurable process targets.
·
Monitor whether processes
are performing as expected.
·
Identify waste, variation,
delay, defects, and cost leakage.
·
Improve accountability
across teams and departments.
·
Support management review
and performance evaluation.
·
Build a culture of
continuous improvement.
·
Connect daily operations
with long-term business goals.
A KPI system is not only a
reporting tool. It is a control system for managing performance.
Effectiveness vs. Efficiency
in KPI Development
One of the most
common mistakes in KPI design is focusing only on efficiency.
Many
organizations measure speed, cost, utilization, productivity, and output
volume. These indicators are important, but they do not always show whether the
organization is achieving the right result.
A process can be
efficient but ineffective.
For example, a
warehouse team may pick orders very quickly, but if many orders are wrong, the
process is not effective. A customer service team may close tickets fast, but
if customers are not satisfied, the process is not effective. A production line
may produce a high quantity per hour, but if defects are high, performance is
not truly successful.
That is why KPI
development must balance two dimensions.
Effectiveness KPIs: Doing the
Right Things
Effectiveness
KPIs measure whether the process achieves the intended outcome.
They focus on
results, quality, customer needs, compliance, and goal achievement.
Examples of
effectiveness KPIs include:
·
Customer satisfaction score
·
On-time delivery rate
·
First pass yield
·
Order accuracy
·
Complaint rate
·
Defect rate
·
Service level achievement
·
Audit conformity rate
·
Corrective action
effectiveness
·
Forecast accuracy
·
Supplier quality
performance
Effectiveness
KPIs answer questions such as:
Did we meet the
customer requirement?
Did we deliver the promised outcome?
Did the process achieve its objective?
Did the action solve the real problem?
Did the output meet quality standards?
Effectiveness is
about value.
Efficiency KPIs: Doing Things Right
Efficiency KPIs measure
how well resources are used to achieve the result.
They focus on time,
cost, productivity, capacity, labor, materials, energy, and waste.
Examples of efficiency
KPIs include:
·
Cycle time
·
Cost per unit
·
Productivity per employee
·
Resource utilization
·
Labor efficiency
·
Machine utilization
·
Inventory turnover
·
Processing time
·
Rework cost
·
Waste percentage
·
Overtime hours
·
Cost of poor quality
Efficiency KPIs answer
questions such as:
How much time did the
process take?
How much did it cost?
How much resource was consumed?
How much waste was generated?
How productive was the team or asset?
Efficiency is about
resource optimization.
The Risk of Measuring Only One Side
Measuring
effectiveness without efficiency can create high service levels at an
unsustainable cost.
Measuring efficiency
without effectiveness can create fast, cheap, and poor-quality outcomes.
For example:
A delivery process
with 98% on-time delivery may look effective, but if it requires excessive
overtime, emergency transport, and high cost, it is not efficient.
A production process
with low labor cost may look efficient, but if defect rates increase and
customers return products, it is not effective.
A call center may
reduce average handling time, but if customers must call again because their
issues were not solved, the KPI is encouraging the wrong behavior.
This is why every
critical process should include both effectiveness and efficiency indicators.
Balanced KPIs prevent
local optimization and encourage better business decisions.
Characteristics of a Strong KPI
A strong KPI should be
clear, measurable, relevant, actionable, and connected to improvement.
Before approving any KPI,
ask these questions:
What business objective
does this KPI support?
Which process does it measure?
Who owns the result?
What is the formula?
What is the data source?
How often will it be measured?
What is the target?
What action will be taken if performance is below target?
Can the team influence the result?
Does it measure effectiveness, efficiency, or both?
If a KPI does not lead to
a decision, discussion, or improvement action, it may not be a real KPI. It may
only be a report number.
A Practical KPI Development
Framework
Step 1: Define the Process Objective
Every KPI should start
with a clear process objective.
For example:
The objective of order
fulfillment is to deliver the right product, in the right quantity, to the
right customer, at the right time, with the right documentation.
From this objective,
we can develop effectiveness and efficiency KPIs.
Effectiveness KPI:
On-time in-full delivery.
Efficiency KPI: Fulfillment cost per order.
Without a clear
process objective, KPI selection becomes random.
Step 2: Identify the Customer
Requirement
Every process has
a customer. The customer may be external or internal.
The customer may
expect speed, quality, accuracy, reliability, safety, compliance, or
responsiveness.
For example:
A retail customer
expects product availability and timely delivery.
A production process expects quality materials from procurement.
A finance team expects complete and accurate documents from operations.
A warehouse team expects clear picking lists from the sales system.
KPIs should
measure whether these expectations are being met.
Step 3: Map the Process Output
A KPI should be linked to a
process output, not just an activity.
Activities are things people
do.
Outputs are the results produced by the process.
For example:
Calling suppliers is an
activity.
Supplier on-time delivery is an output.
Training employees is an
activity.
Reduction in errors after training is an output.
Inspecting products is an
activity.
Defect reduction is an output.
Good KPI development focuses
on outputs and outcomes, not only activities.
Step 4: Separate Leading and
Lagging KPIs
Lagging KPIs
measure results after they happen.
Examples include
monthly sales, defect rate, customer complaints, delivery performance, and
profit margin.
Leading KPIs
predict future performance and help prevent problems before they happen.
Examples include
schedule adherence, preventive maintenance completion, training completion,
supplier confirmation rate, and process audit compliance.
A strong KPI
system includes both.
Lagging KPIs tell
you what happened.
Leading KPIs help you control what will happen.
Step 5: Define the KPI Formula
A KPI must have a clear
formula.
If different people
calculate the same KPI in different ways, the result cannot be trusted.
For example:
On-Time Delivery % =
Number of orders delivered on or before the promised date ÷ Total delivered
orders × 100
First Pass Yield % =
Units accepted without rework ÷ Total units produced × 100
Complaint Rate =
Number of customer complaints ÷ Total orders × 100
Productivity =
Output quantity ÷ Labor hours
Cost per Unit =
Total process cost ÷ Number of units processed
The formula should be
documented and controlled.
Step 6: Define the Data Source
A KPI is only as reliable as
its data source.
Before launching a KPI, the
organization must define where the data will come from.
Possible data sources
include:
·
ERP system
·
CRM system
·
Warehouse management system
·
Production records
·
Quality inspection reports
·
Customer feedback forms
·
Financial reports
·
Maintenance records
·
Audit reports
·
Manual logs
If the data source is weak,
incomplete, or inconsistent, the KPI will create confusion instead of control.
Wrong data leads to wrong
decisions.
Step 7: Set a Target
A KPI without a target is just a
number.
Targets create direction and
accountability.
Targets may be based on:
·
Customer requirements
·
Contractual commitments
·
Historical performance
·
Industry benchmarks
·
Strategic objectives
·
Budget expectations
·
Regulatory requirements
·
Continuous improvement
goals
For example:
On-time delivery target: 95%
Customer satisfaction target: 90%
Defect rate target: less than 1%
Cycle time target: less than 24 hours
Inventory accuracy target: 98%
The target should be realistic,
challenging, and reviewed regularly.
Step 8: Define Review Frequency
Different KPIs require
different review frequencies.
Some KPIs should be
reviewed daily.
Some should be reviewed weekly.
Some should be reviewed monthly or quarterly.
For example:
Daily KPIs may include
production output, safety incidents, order backlog, and delivery failures.
Weekly KPIs may include
productivity, quality defects, schedule adherence, and customer complaints.
Monthly KPIs may include
cost performance, supplier performance, profitability, and strategic
objectives.
The review frequency should
match the speed of decision-making required.
A KPI that is reviewed too
late loses its value.
Step 9: Assign Ownership
Every KPI must have an owner.
The KPI owner is responsible for
monitoring the result, explaining performance, identifying gaps, and leading
improvement actions.
Ownership does not mean blame. It
means accountability.
A good KPI system defines:
·
KPI owner
·
Data owner
·
Review frequency
·
Escalation rule
·
Corrective action
responsibility
·
Reporting format
When KPI ownership is unclear,
performance management becomes weak.
Step 10: Link KPIs to Action
The most important question is
not “What is the KPI result?”
The most important question is
“What will we do because of the KPI result?”
A KPI should trigger action
when performance is below target.
Examples of KPI-driven actions
include:
·
Root cause analysis
·
Corrective action
·
Process redesign
·
Resource reallocation
·
Supplier development
·
Training
·
Standard operating
procedure revision
·
Automation
·
Waste reduction
·
Preventive maintenance
·
Management review
A KPI that does not lead to
action becomes decoration.
Examples of Balanced KPIs by Process
Sales Process
Effectiveness KPIs:
·
Conversion rate
·
Customer acquisition rate
·
Sales target achievement
·
Customer retention rate
Efficiency KPIs:
·
Cost per lead
·
Sales cycle time
·
Revenue per salesperson
·
Proposal turnaround time
Procurement Process
Effectiveness KPIs:
·
Supplier on-time delivery
·
Supplier quality acceptance
rate
·
Purchase order accuracy
·
Material availability
Efficiency KPIs:
·
Procurement cycle time
·
Cost saving percentage
·
Number of emergency
purchases
·
Purchasing cost per order
Warehouse Process
Effectiveness KPIs:
·
Inventory accuracy
·
Order picking accuracy
·
On-time dispatch rate
·
Damage rate
Efficiency KPIs:
·
Picks per labor hour
·
Storage utilization
·
Cost per order
·
Dock-to-stock cycle time
Manufacturing Process
Effectiveness KPIs:
·
First pass yield
·
Defect rate
·
Overall equipment
effectiveness
·
Schedule adherence
Efficiency KPIs:
·
Cycle time
·
Labor productivity
·
Machine utilization
·
Waste percentage
·
Cost per unit
Customer Service Process
Effectiveness KPIs:
·
First contact resolution
·
Customer satisfaction score
·
Complaint resolution rate
·
Service quality score
Efficiency KPIs:
·
Average handling time
·
Tickets closed per agent
·
Cost per ticket
·
Backlog volume
KPI Development and ISO 9001
KPI development strongly
supports ISO 9001 quality management principles, especially process
performance, customer satisfaction, monitoring, measurement, analysis,
evaluation, and continual improvement.
ISO-based management systems
require organizations to determine what needs to be monitored and measured, how
measurement will be performed, when results will be analyzed, and how results
will be used for improvement.
This makes KPI development an
essential part of a strong quality management system.
KPIs help organizations
demonstrate that processes are controlled, objectives are monitored, customer
requirements are considered, and improvement actions are based on evidence.
In a practical ISO 9001
environment, KPIs should be connected to:
·
Quality objectives
·
Process performance
·
Customer satisfaction
·
Risk management
·
Supplier performance
·
Nonconformities
·
Corrective actions
·
Internal audit results
·
Management review
·
Continual improvement
A good KPI system does not
only support certification. It supports better management.
Common KPI Development Mistakes
Many organizations
struggle with KPIs because they fall into common traps.
Measuring Too Many KPIs
Too many KPIs create confusion and reporting overload.
The goal is not to measure everything.
The goal is to measure what matters.
Each process should have a focused number of critical
KPIs.
Measuring What Is Easy Instead of
What Is Important
Some data is easy to collect but not
useful for decision-making.
For example, counting the number of
training hours is easy. But measuring whether training reduced errors is more
meaningful.
A strong KPI should reflect
performance, not just activity.
Using KPIs Without Targets
Without a target, managers cannot know whether
performance is acceptable or not.
Every KPI should have a clear target, tolerance, or
performance threshold.
Poor
Data Quality
If data is inaccurate, late, incomplete, or manually
manipulated, KPI credibility will be damaged.
Before developing advanced dashboards, organizations should
fix data recording discipline.
No Link to Corrective Action
KPI reporting without action creates frustration.
When performance is below target, there should be
a clear improvement process.
Rewarding the Wrong Behavior
Poorly designed KPIs can create harmful behavior.
For example, measuring only speed may reduce
quality.
Measuring only cost may damage service.
Measuring only output may increase defects.
Balanced KPIs reduce this risk.
KPI Dashboard Design
A KPI dashboard should be simple,
visual, and action-oriented.
A good dashboard should show:
·
KPI name
·
Formula
·
Current result
·
Target
·
Trend
·
Status
·
Owner
·
Root cause if below target
·
Corrective action
·
Due date
·
Action status
Visual indicators can help management
understand performance quickly, but the dashboard should not become more
important than the decision.
The purpose of the dashboard is not
to look beautiful.
The purpose is to help people act faster and better.
KPI Review Meetings
KPIs should be reviewed in structured
performance meetings.
A strong KPI review meeting should
focus on:
What changed?
Why did it change?
What is the risk?
What action is required?
Who owns the action?
When will it be completed?
How will effectiveness be verified?
The meeting should not be a blame
session. It should be a performance improvement session.
When KPI meetings are managed
correctly, they improve collaboration, problem-solving, and accountability.
From KPI Reporting to Continuous
Improvement
The highest value
of KPI development comes when measurement becomes improvement.
The KPI cycle
should follow this logic:
Define the
objective.
Measure the result.
Compare against target.
Analyze the gap.
Identify root cause.
Take corrective action.
Verify effectiveness.
Standardize the improvement.
Review the KPI again.
This cycle turns
KPIs from static numbers into a continuous improvement engine.
How OpexEdge Supports KPI
Development
OpexEdge Consultancy
helps organizations develop practical KPI systems that connect strategy,
processes, people, and performance.
Our approach focuses
on building KPIs that are measurable, relevant, balanced, and actionable.
OpexEdge can support
organizations through:
·
Process mapping
·
KPI development workshops
·
Effectiveness and
efficiency KPI design
·
KPI formula definition
·
KPI dashboard structure
·
Data collection templates
·
Performance review systems
·
Corrective action linkage
·
ISO 9001-aligned
performance evaluation
·
Continuous improvement
planning
The goal is not only
to create KPIs.
The goal is to create a performance management system that improves decisions
and results.
Conclusion
KPI development is one of the most important
foundations of operational excellence.
The right KPIs help organizations understand
whether they are achieving the right outcomes and whether they are using
resources wisely.
Effectiveness KPIs show whether the process
delivers value.
Efficiency KPIs show whether the process uses resources properly.
When both dimensions are measured together,
organizations gain a balanced view of performance.
A strong KPI system does not simply report the
past. It guides better decisions, drives improvement, strengthens
accountability, and supports sustainable business growth.
In the end, what gets measured can be managed.
But only what is measured correctly can be improved.

14 Comments