
Pareto Principle 80/20: How to Focus on the Vital Few That Drive Operational Performance
In every business, not all problems are equal.
Some issues consume time but create little real damage. Others look small at first but silently drive most of the cost, waste, delay, customer complaints, quality defects, and operational instability.
This is where the Pareto Principle 80/20 becomes one of the most powerful thinking tools in operational excellence.
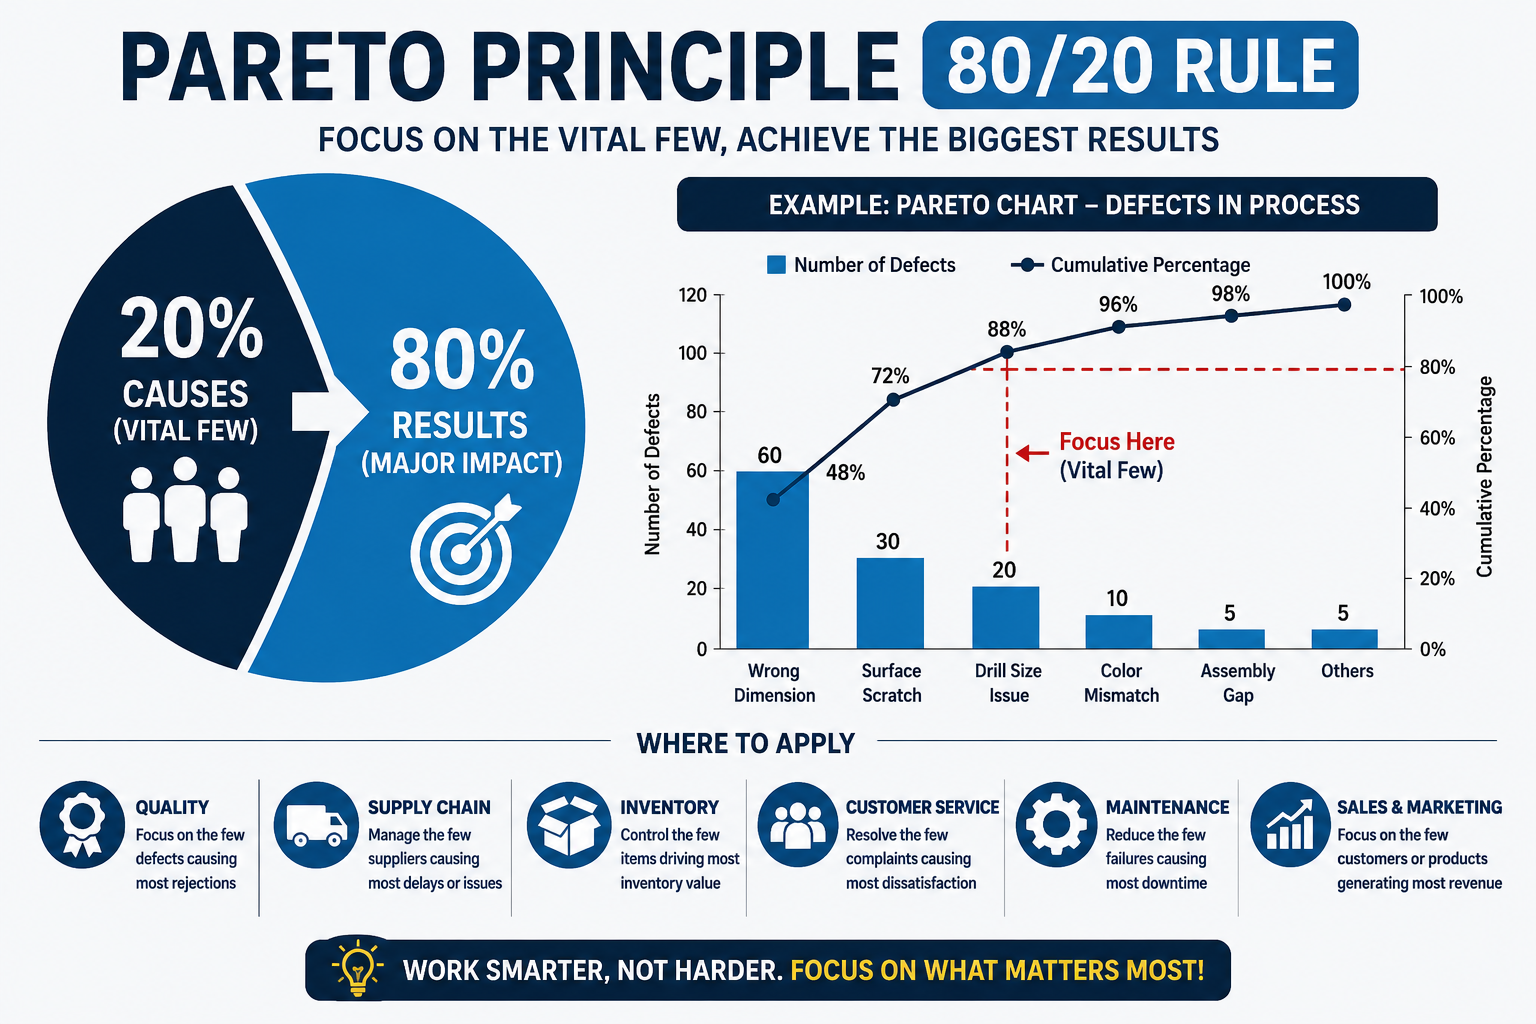
The Pareto Principle, also known as the 80/20 rule, states that a small number of causes often create the majority of results. In business terms, this means that around 20% of causes may be responsible for around 80% of the impact.
The exact ratio is not always 80/20. It may be 70/30, 90/10, or another uneven pattern. The real message is simple: performance is rarely distributed equally.
For leaders, process owners, quality teams, supply chain managers, and continuous improvement professionals, Pareto analysis helps answer one critical question:
Where should we focus first to achieve the biggest measurable improvement?
What Is the Pareto Principle?
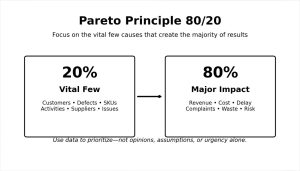
The Pareto Principle is a prioritization concept used to identify the “vital few” factors that create the largest share of outcomes.
In operations, this may appear in many forms:
A small number of defect types may cause most quality rejections.
A few suppliers may be responsible for most late deliveries.
A limited group of SKUs may generate most revenue.
A few customers may create most complaints.
A small number of process steps may create most delays.
A few machines may cause most downtime.
A small group of root causes may create most safety incidents.
Instead of treating every issue with the same urgency, Pareto thinking helps teams focus resources where they matter most.
This makes it especially useful in environments where time, budget, manpower, and management attention are limited.
Why the 80/20 Rule Matters in Operational Excellence
Operational excellence is not about working harder on everything at the same time.
It is about improving the right things in the right order.
Many organizations fail because they try to solve too many problems at once. Teams open dozens of improvement actions, but few are completed properly. Resources become scattered, priorities become unclear, and results remain weak.
The Pareto Principle prevents this problem by creating a data-driven focus.
It helps organizations move from:
“We have many problems.”
to:
“These are the few problems creating most of the damage.”
This shift improves decision-making, resource allocation, project selection, and improvement speed.
Pareto Principle vs. Pareto Chart
The Pareto Principle is the concept.
The Pareto Chart is the visual tool used to apply the concept.
A Pareto chart combines:
A bar chart showing categories ranked from highest to lowest.
A cumulative percentage line showing how much total impact has been explained.
This visual format allows teams to quickly identify which categories contribute most to the total problem.
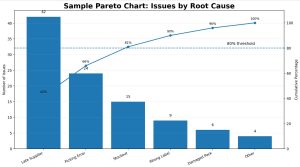
For example, if a warehouse has 100 monthly order issues, the Pareto chart may show:
Late supplier deliveries: 42 issues
Picking errors: 24 issues
Stockouts: 15 issues
Wrong labels: 9 issues
Damaged packaging: 6 issues
Other causes: 4 issues
In this case, the first three causes represent most of the issue volume. The improvement team should not start with every possible cause. It should focus first on supplier reliability, picking accuracy, and stock availability.
That is the practical power of Pareto analysis.
Where to Use Pareto Analysis
Pareto analysis can be applied across almost every business function.
1. Quality Management
In quality control, Pareto analysis helps identify the defect types that cause the highest rejection, rework, scrap, or warranty cost.
Instead of investigating every defect equally, teams focus on the top defect categories first.
This supports Six Sigma, root cause analysis, corrective actions, and cost of poor quality reduction.
2. Supply Chain and Procurement
Procurement teams can use Pareto analysis to classify suppliers by spend, delivery failures, quality issues, or risk exposure.
For example, 20% of suppliers may represent 80% of purchase value. These suppliers require stronger contracts, performance reviews, risk monitoring, and relationship management.
3. Inventory Management
Inventory teams often use ABC analysis, which is closely related to Pareto thinking.
A small percentage of items may represent most inventory value or sales movement. These items need tighter planning, more accurate forecasting, and stronger availability control.
Slow-moving and low-value items can be managed differently.
4. Customer Service
Customer service teams can use Pareto charts to identify the most common complaint types.
If most complaints come from delivery delays, unclear communication, or product damage, improvement efforts should focus on these areas first.
This helps improve customer satisfaction without wasting resources on low-impact issues.
5. Maintenance and Reliability
Maintenance teams can use Pareto analysis to identify which machines, failure modes, or spare parts cause most downtime.
This supports preventive maintenance, reliability improvement, and Total Productive Maintenance programs.
6. Sales and Marketing
Sales teams can use Pareto analysis to identify top customers, products, regions, or channels.
This helps management understand where revenue is truly coming from and where commercial effort should be prioritized.
However, this must be handled carefully. The goal is not to ignore smaller customers, but to design the right service model for each segment.
How to Perform Pareto Analysis Step by Step
Step 1: Define the Problem Clearly
Start with a measurable problem.
Examples:
Order delays increased by 18%.
Customer complaints reached 320 cases per month.
Machine downtime reached 240 hours per quarter.
Warehouse picking errors increased to 4.5%.
The problem must be specific. A vague problem creates weak analysis.
Step 2: Select the Measurement Unit
Decide what you will measure.
This may include:
Frequency
Cost
Time lost
Defect quantity
Complaint count
Downtime hours
Revenue contribution
Risk score
Choosing the wrong measure can mislead the analysis.
For example, the most frequent defect is not always the most expensive defect. In some cases, cost impact is more important than frequency.
Step 3: Collect Reliable Data
Pareto analysis depends on accurate data.
Data can come from:
ERP systems
CRM systems
Quality reports
Maintenance logs
Warehouse records
Customer complaint systems
Audit findings
Process observations
The data period should be long enough to show a real pattern but recent enough to reflect current performance.
Step 4: Group the Causes into Categories
Create meaningful categories.
For example, order delay causes may include:
Supplier delay
Stockout
Picking error
Transport delay
System issue
Approval delay
Wrong master data
Avoid too many categories, because the analysis becomes noisy. Also avoid vague categories like “miscellaneous” unless absolutely necessary.
Step 5: Rank Categories from Highest to Lowest
Sort the categories by impact.
The highest contributor appears first. The lowest appears last.
This ranking immediately shows where the largest opportunity exists.
Step 6: Calculate the Cumulative Percentage
Add a cumulative percentage line to show how much total impact is covered as categories are added.
The point where the cumulative line approaches 80% usually highlights the vital few categories.
Step 7: Select Improvement Priorities
Select the top causes for deeper root cause analysis.
Pareto analysis tells you where to look. It does not automatically tell you why the problem exists.
After identifying the vital few, use tools such as:
5 Whys
Fishbone diagram
Process mapping
Gemba walk
Failure Mode and Effects Analysis
Control charts
Root cause verification
Step 8: Implement and Monitor Improvements
After improvement actions are implemented, repeat the Pareto analysis.
This confirms whether the top causes have reduced and whether new issues have emerged.
Continuous improvement requires repeated measurement, not one-time analysis.
Case Study: Reducing Warehouse Order Errors Using Pareto Analysis
A retail distribution operation was experiencing a high number of customer complaints related to order fulfillment.
The management team initially believed that the problem was caused by warehouse staff performance. However, the team decided to collect actual data before assigning blame.
Complaint data for one month showed the following:
Wrong item picked: 38%
Late dispatch: 27%
Missing item: 14%
Damaged packaging: 9%
Wrong label: 7%
Other issues: 5%
The Pareto analysis showed that wrong item picking and late dispatch represented the majority of complaints.
Instead of launching a general warehouse improvement campaign, the team focused on two areas:
Improving bin location accuracy.
Introducing barcode scanning at picking confirmation.
Revising daily dispatch cut-off controls.
Separating urgent orders from normal orders.
Training pickers using the top error examples.
Within three months, picking errors dropped significantly, dispatch reliability improved, and customer complaints decreased.
The lesson was clear: the business did not need to improve everything at once. It needed to focus on the few causes creating most of the customer dissatisfaction.
Common Mistakes When Applying the Pareto Principle
Mistake 1: Treating 80/20 as a Fixed Law
The 80/20 ratio is not guaranteed.
The goal is not to force the data to match 80/20. The goal is to discover whether the impact is concentrated in a few causes.
Mistake 2: Using Poor Data
If data is incomplete, outdated, or wrongly classified, the Pareto chart will produce misleading conclusions.
Bad data creates bad priorities.
Mistake 3: Confusing Symptoms with Root Causes
A Pareto chart may show “late delivery” as the top issue.
But late delivery may be caused by poor forecasting, supplier unreliability, insufficient stock, weak routing, or approval delays.
Pareto analysis identifies the priority area. Root cause analysis explains the reason behind it.
Mistake 4: Ignoring Strategic Importance
Not every low-frequency issue is low priority.
For example, a safety risk may happen rarely but have severe consequences. A major compliance failure may not appear frequently but still require urgent action.
Pareto analysis should support decision-making, not replace judgment.
Mistake 5: Focusing Only on Problems
The Pareto Principle can also identify strengths.
A few products may create most profit.
A few customers may create most growth.
A few marketing channels may create most qualified leads.
A few employees may generate most improvement ideas.
This makes Pareto analysis useful for both problem-solving and growth strategy.
Pareto Principle and Lean Six Sigma
Pareto analysis is widely used in Lean Six Sigma projects, especially in the Define and Analyze phases of DMAIC.
In the Define phase, it helps select the most important business problem.
In the Measure phase, it helps quantify the size of each issue.
In the Analyze phase, it helps prioritize root cause investigation.
In the Improve phase, it helps focus solutions on high-impact causes.
In the Control phase, it helps monitor whether the improvement remains stable.
This makes the Pareto Principle one of the most practical tools for structured business improvement.
Practical Examples of the Pareto Principle
Manufacturing
A factory may discover that three defect types cause most of its scrap cost. By solving these defect types, the factory can reduce waste faster than by spreading effort across all defects.
Retail
A retailer may find that a small number of SKUs create most sales revenue. These items should receive better demand planning, stock availability control, and replenishment discipline.
Healthcare
A clinic may find that most patient waiting time comes from registration delays and appointment scheduling issues. Improvement should begin there.
Logistics
A logistics company may find that most delivery failures come from a few routes or delivery partners. These areas should receive focused performance management.
Service Business
A consulting firm may find that a small number of service packages generate most revenue. This can guide marketing, pricing, and resource planning.
How Leaders Should Use the Pareto Principle
Leaders should use Pareto thinking as a management discipline.
Before launching improvement actions, ask:
Which problems create the highest cost?
Which customers create the highest value?
Which products create the highest profit?
Which process steps create the longest delays?
Which causes create the most defects?
Which suppliers create the most disruption?
Which risks create the highest exposure?
These questions create focus.
And focus is one of the strongest drivers of execution.
Pareto Principle Checklist
Use this checklist before starting a Pareto analysis:
The problem is clearly defined.
The measurement unit is selected.
The data source is reliable.
The time period is appropriate.
The categories are meaningful.
The data is sorted from highest to lowest.
The cumulative percentage is calculated.
The vital few are identified.
Root cause analysis is performed after prioritization.
Improvement actions are monitored after implementation.
Final Thoughts
The Pareto Principle 80/20 is powerful because it challenges one of the most common management mistakes: treating all problems as equal.
In reality, a small number of causes often create most of the business impact.
When organizations identify these causes, they can reduce waste, improve quality, accelerate delivery, increase customer satisfaction, and use resources more intelligently.
Pareto analysis does not solve the problem by itself. But it tells you where to focus first.
And in operational excellence, focus is often the difference between activity and real improvement.
Call to Action
At OpexEdge, we help organizations identify the vital few problems that create the biggest operational losses across quality, supply chain, inventory, procurement, maintenance, customer service, and process performance.
If your business is facing repeated delays, defects, stock issues, customer complaints, high costs, or weak process performance, Pareto analysis can help you move from scattered actions to focused improvement.
Contact OpexEdge Consultancy to assess your processes, prioritize improvement opportunities, and build a practical operational excellence roadmap.
Website: opexedg.com
Email: info@opexedg.com
Email: hefnawi@opexedg.com
Mobile: +201552725900
Related TopicsTPM, Hypothesis Test , Accuracy, 6Sigma, MSA, POKAYOKE, MUDA, 5S, FMEA, SIPOC, KPI, ISO9001, ISO20022, w/h, demand planning , OTB , KANO, case study, OTB service, demand planning service , SC service, problem solving service ,

1 Comment