
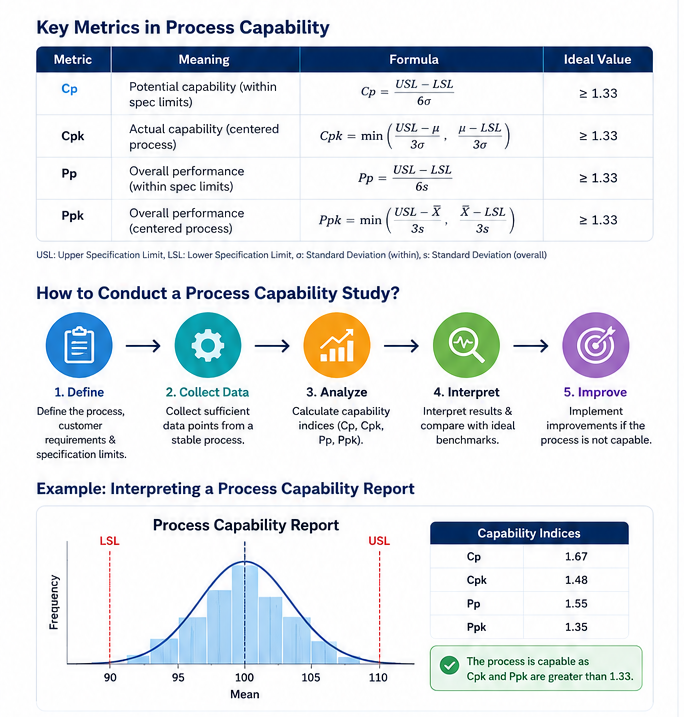
Process Capability Study:
Turning Process Variation into Measurable Business Control
A
process can look good on the surface and still be incapable of meeting customer
requirements.
Production
may be running. Operators may be busy. Inspection reports may be completed.
Customers may still be receiving products or services that vary too much,
arrive with defects, or require rework.
This
is why a Process Capability Study is one of the most important tools in
quality management, Six Sigma, manufacturing excellence, and operational
improvement.
A
process capability study answers a simple but powerful question:
Can
this process consistently produce output within specification limits?
Not
once. Not by luck. Not only when the best operator is on shift.
Consistently.
For
manufacturers, service providers, laboratories, warehouses, maintenance teams,
and supply chains, process capability connects process performance directly to
customer requirements. It turns variation into numbers. It helps leaders
understand whether a process is stable, centered, capable, and ready for
improvement.
At
OpexEdge, we see process capability as more than a statistical calculation. It
is a management decision tool. It tells you whether your process is ready for
production, ready for customer approval, ready for scaling, or still needs
improvement.
Suggested Featured Image
Image concept: A clean
operational-excellence dashboard showing a bell curve between LSL and USL,
Cp/Cpk scorecards, control chart trend, and an improvement arrow. Use
OpexEdge-style blue and gold colors, professional consultancy look, modern
manufacturing/data theme.
Alt text: Process
capability study dashboard showing Cp, Cpk, specification limits, process
variation, and operational improvement.
What Is a Process Capability Study?
A process capability
study is a structured statistical analysis used to evaluate how well a
process can meet defined specification limits.
In simple words, it
compares two things:
1.
What the customer or
design requires
2.
What the process
actually produces
The customer
requirement is usually expressed through specification limits:
·
USL: Upper
Specification Limit
·
LSL: Lower
Specification Limit
·
Target: Ideal value
or nominal value
The process performance
is measured through actual data collected from the process.
If the process
variation fits comfortably inside the specification limits, the process may be
capable.
If the process spread
is too wide, or the process average is too close to one limit, the process may
generate defects even if the current sample looks acceptable.
That is why process
capability is not only about the average. It is about both:
·
Variation
·
Centering
A process with low
variation but poor centering can still fail.
A process centered on
the target but with high variation can also fail.
A capable process needs
both discipline and control.
Why Process Capability Matters
Process capability matters
because customers do not buy averages.
Customers experience
individual units, individual deliveries, individual service results, and
individual transactions.
A factory may say, “Our
average dimension is correct.”
But the customer may still
receive parts that are too small or too large.
A warehouse may say, “Our
average delivery time is acceptable.”
But key customers may still
receive late shipments.
A service center may say,
“Our average response time is good.”
But some customers may
still wait too long.
Process capability helps
organizations stop hiding behind averages and start managing real variation.
It supports better
decisions in:
·
Product approval
·
Supplier qualification
·
Machine validation
·
Process improvement
·
Quality control
·
Six Sigma projects
·
Customer complaint
reduction
·
Cost of poor quality
reduction
·
Production readiness
·
Continuous improvement
If you already use SPC Statistical Process
Control, capability analysis is
the next logical step. SPC tells you whether the process is stable over time.
Process capability tells you whether that stable process can meet customer
specifications.
Process Stability Comes Before
Process Capability
This is one of
the biggest mistakes in capability analysis.
Many teams
calculate Cpk before proving that the process is stable.
That is risky.
A process
capability study should be performed on a process that is already statistically
stable. If the process is affected by special causes, machine breakdowns,
untrained operators, unstable materials, inconsistent methods, or measurement
problems, the capability result may be misleading.
Before trusting
Cp or Cpk, ask:
·
Is the process under
statistical control?
·
Are there special-cause
signals on the control chart?
·
Is the measurement system
reliable?
·
Are the data collected
under normal operating conditions?
·
Are the specification
limits clearly defined?
·
Is the sample size
sufficient?
·
Is the distribution
suitable for the selected method?
If the answer is
no, do not rush to calculate capability.
First, stabilize
the process.
Then evaluate
capability.
This is why
capability analysis is strongly connected to Control Charts and Gage
R&R / Measurement System Analysis.
Cp and Cpk: The Core Capability
Indices
The two most common
capability indices are Cp and Cpk.
They are related,
but they do not mean the same thing.
What Is Cp?
Cp measures the potential capability of
a process.
It compares the width of the specification
limits with the natural spread of the process.
The common formula is:
Cp = (USL – LSL) / 6σ
Where:
·
USL = Upper Specification
Limit
·
LSL = Lower Specification
Limit
·
σ = Process standard
deviation
Cp answers this question:
If the process were perfectly centered,
would the variation fit inside the specification limits?
A higher Cp means the process spread is smaller
compared with the tolerance width.
But Cp does not care whether the process is
centered.
That is why Cp alone is not enough.
What Is Cpk?
Cpk measures actual process capability
by considering both variation and centering.
It checks how close the process mean is to the
nearest specification limit.
The common formula is:
Cpk = min [(USL – Mean) / 3σ, (Mean – LSL)
/ 3σ]
Cpk answers this question:
Considering where the process average
actually sits, how capable is the process of meeting specifications?
If Cp is high but Cpk is low, the process has
potential but is not centered.
That means improvement should focus on
shifting the process average toward the target.
If both Cp and Cpk are low, the process has
too much variation and may require deeper improvement.
Cp vs Cpk: Simple Interpretation
Situation | Meaning | Likely Action |
Cp high, Cpk high | Process is narrow and | Maintain control and |
Cp high, Cpk low | Process has potential | Center the process |
Cp low, Cpk low | Process variation is too | Reduce variation |
Cp acceptable, Cpk | Process is mostly | Improve centering and |
Cpk near zero or | Process average is near | Immediate corrective |
Pp and Ppk: Process Performance
Indices
While Cp and Cpk
are commonly used for short-term process capability, Pp and Ppk
are often used to describe overall process performance.
The difference is
usually related to how variation is estimated.
·
Cp and Cpk focus on
within-process variation when the process is stable.
·
Pp and Ppk use
overall variation, often including long-term effects.
Pp and Ppk can show
how the process performs in real operating conditions over time.
A useful rule of
thinking is:
·
Cp/Cpk: What the
process can do under stable conditions
·
Pp/Ppk: What the
process has actually been doing overall
If Cpk is much
better than Ppk, the process may be suffering from long-term shifts, batch
differences, machine changes, operator variation, seasonal effects, or
inconsistent material quality.
This gap can be
very valuable for operational improvement.
Common Process Capability Benchmarks
Different industries
and customers may set different acceptance criteria. However, the following
interpretation is commonly used in many quality environments.
Index Value | General |
Less than 1.00 | Process is not |
1.00 | Process spread |
1.33 | Common minimum |
1.67 | Stronger capability |
2.00 or higher | Very high |
Important note:
Do not treat these
values as universal rules.
Customer
requirements, industry standards, risk level, safety impact, sample size, and
measurement uncertainty must be considered.
A Cpk of 1.33 may be
acceptable for one characteristic and unacceptable for another
critical-to-safety characteristic.
Capability numbers
must always be interpreted with business and customer context.
Image 1: Cp vs Cpk Explanation
Image concept: Two
bell curves inside specification limits. First curve centered with high Cp and
high Cpk. Second curve narrow but shifted toward USL, showing high Cp but lower
Cpk.
Caption: Cp shows
potential capability. Cpk shows actual capability after considering process
centering.
Alt text: Cp versus
Cpk comparison showing centered and off-center process distributions within
specification limits.
When Should You Conduct a Process
Capability Study?
A process
capability study is useful whenever an organization needs evidence that a
process can meet requirements.
Common situations
include:
·
New product introduction
·
New machine approval
·
New supplier approval
·
Production line validation
·
After major process changes
·
After tooling replacement
·
Before mass production
·
After corrective actions
·
During Six Sigma DMAIC
projects
·
Before customer audits
·
Before reducing inspection
frequency
·
When complaints or defects
increase
·
When process variation is
suspected
In Six Sigma, capability
analysis is usually used during the Measure, Analyze, Improve, and Control
phases. It helps teams quantify the baseline problem and verify whether
improvement actions actually delivered measurable performance improvement.
Step-by-Step Process Capability
Study Methodology
A strong
capability study should follow a disciplined method.
Step 1: Define the Process and
Characteristic
Start by
selecting the process and the quality characteristic to study.
Examples:
·
Shaft diameter
·
Fill weight
·
Delivery lead time
·
Invoice processing time
·
Temperature control
·
Weld strength
·
Defect rate
·
Order picking accuracy
·
Machine cycle time
·
Customer response time
The selected
characteristic should be important to the customer, product, safety, cost, or
process performance.
Avoid studying
data simply because it is available.
Study what
matters.
This connects
directly with good KPI Development. A capable
process should be measured using indicators that reflect both effectiveness and
efficiency.
Step 2: Confirm Specification Limits
Before collecting
data, confirm the specification limits.
You need to know:
·
Upper Specification Limit
·
Lower Specification Limit
·
Target value
·
Unit of measurement
·
Customer or engineering
source of specification
·
Whether one-sided or
two-sided capability applies
Some processes have
only one specification limit.
For example:
·
Delivery time must be less
than 48 hours.
·
Defect rate must be below
1%.
·
Strength must be above a
minimum value.
·
Waiting time must not
exceed 10 minutes.
In these cases,
one-sided capability analysis may be more appropriate.
Step 3: Validate the Measurement
System
Bad measurement
creates bad decisions.
Before you judge
the process, check whether the measurement system is reliable.
A process may
appear unstable or incapable simply because the measuring device, method,
operator, or environment is introducing variation.
For measured data,
a Gage R&R Study can help evaluate
repeatability and reproducibility.
Ask:
·
Is the measuring device
calibrated?
·
Is the resolution suitable?
·
Are operators trained?
·
Is the method standardized?
·
Is there
operator-to-operator variation?
·
Is the measurement
environment controlled?
·
Is the data collection
method consistent?
If the measurement
system is not acceptable, improve it before performing the capability study.
Step 4: Collect Representative Data
The data must represent
the real process.
Avoid collecting only
the best data, only one shift, only one operator, or only one short production
period if the process normally operates under wider conditions.
Data should reflect:
·
Normal operating conditions
·
Different shifts where
relevant
·
Different operators where
relevant
·
Material batch variation
·
Machine settings
·
Environmental conditions
·
Actual production sequence
The goal is not to make
the process look good.
The goal is to
understand the truth.
Step 5: Check Process Stability
Using Control Charts
Before
calculating capability indices, review the process behavior over time.
Use control
charts to detect special causes such as:
·
Sudden shifts
·
Trends
·
Cycles
·
Points outside control
limits
·
Non-random patterns
·
Process instability
If the process is
unstable, capability numbers are not reliable.
In that case,
perform root cause analysis first.
You can use Root Cause
Analysis, Fishbone Diagram and 5 Whys to identify the
drivers of instability.
Step 6: Check Data Distribution
Many common capability
calculations assume a normal distribution.
However, not all processes
follow a normal distribution.
Examples of non-normal
behavior may include:
·
Cycle time
·
Delivery lead time
·
Waiting time
·
Failure data
·
Wear-related
characteristics
·
Skewed service data
·
Batch processes
·
Attribute data
If the data is non-normal,
using standard Cp and Cpk without checking assumptions may produce misleading
results.
Possible approaches
include:
·
Data transformation
·
Non-normal capability
analysis
·
Percentile-based analysis
·
Attribute capability
analysis
·
Separate analysis by
product family, machine, supplier, or condition
The method should fit the
data, not the other way around.
Step 7: Calculate Capability and
Performance Indices
After confirming
measurement reliability, stability, and distribution assumptions, calculate the
relevant indices.
Common outputs
include:
·
Cp
·
Cpk
·
Pp
·
Ppk
·
Mean
·
Standard deviation
·
Target deviation
·
Expected defect rate
·
Histogram
·
Control chart
·
Capability plot
·
Confidence intervals where
applicable
The best
capability study does not only show numbers. It explains what the numbers mean
and what action is required.
Step 8: Interpret the Result and
Define Actions
A capability
study should lead to action.
Possible actions
include:
·
Maintain current process
control
·
Center the process average
·
Reduce process variation
·
Improve machine capability
·
Improve material
consistency
·
Improve operator training
·
Improve work instructions
·
Improve preventive
maintenance
·
Upgrade measuring equipment
·
Segment the process by
product, machine, supplier, or shift
·
Redesign the process
·
Renegotiate unrealistic
specifications
·
Increase inspection
temporarily
·
Launch a formal improvement
project
Capability
analysis is not the end of improvement.
It is the
evidence that guides improvement.
Image 2: Process Capability Study
Roadmap
Image concept:
Eight-step roadmap: Define characteristic → Confirm specs → Validate
measurement → Collect data → Check stability → Check distribution → Calculate
Cp/Cpk/Pp/Ppk → Improve and control.
Caption: A
reliable capability study follows a disciplined sequence before interpreting Cp
and Cpk.
Alt text:
Process capability study roadmap showing steps from specification definition to
capability improvement and control.
Practical Case Study: Reducing
Variation in a Filling Process
A food
manufacturing company was facing customer complaints because product fill
weight was inconsistent.
The target fill
weight was 500 grams.
The specification
limits were:
·
LSL = 495 grams
·
USL = 505 grams
·
Target = 500 grams
Initial data
showed that the average was close to target, but the variation was too wide.
The process sometimes produced underfilled units and overfilled units.
The initial
capability result showed low Cpk.
The team followed
a structured improvement approach:
1.
Validated the weighing
system.
2.
Checked control charts for
special-cause variation.
3.
Identified filling-machine
pressure fluctuation.
4.
Standardized machine setup.
5.
Improved preventive
maintenance.
6.
Trained operators on
adjustment rules.
7.
Rechecked capability after
improvement.
After reducing
variation, the process achieved a stronger Cpk value and fewer customer
complaints.
The most
important lesson was clear:
The problem was
not only inspection.
The problem was
process variation.
By controlling
the process, the company reduced waste, improved customer confidence, and
protected margin.
Process Capability in Manufacturing
In manufacturing,
process capability is often used for critical dimensions, weights, strengths,
temperatures, pressures, torque values, coating thickness, chemical
composition, and other measurable characteristics.
It helps answer
questions such as:
·
Can the machine
consistently meet tolerance?
·
Is the process ready for
mass production?
·
Is the supplier capable?
·
Should inspection frequency
be reduced or increased?
·
Is the tooling worn?
·
Is the process drifting?
·
Did improvement actions
work?
·
Is the customer
specification realistic?
Manufacturing teams
should not treat capability analysis as a one-time report for audits.
It should be part of
the quality management system and continuous improvement cycle.
Process Capability in Services
and Operations
Process
capability is not only for factories.
It can also be
applied to service and operational processes.
Examples:
·
Order lead time
·
Delivery time
·
Customer response time
·
Invoice processing time
·
Picking accuracy
·
Call center waiting time
·
Maintenance response time
·
Complaint closure time
·
Forecast accuracy
·
Warehouse cycle time
For service
processes, the data may not always be normally distributed. But the principle
remains powerful:
Can the process
consistently meet the customer requirement?
If a company
promises delivery within 48 hours, capability analysis can show whether that
promise is realistic based on actual process performance.
If customer
service promises response within 2 hours, capability analysis can show the risk
of missing that target.
This turns
service quality from opinion into measurable control.
Capability Analysis and Cost of
Poor Quality
Poor capability
creates cost.
When a process is
not capable, the organization pays through:
·
Scrap
·
Rework
·
Returns
·
Warranty claims
·
Sorting
·
Extra inspection
·
Customer complaints
·
Lost sales
·
Premium freight
·
Overtime
·
Delayed delivery
·
Reputation damage
A process
capability study helps quantify risk before it becomes financial damage.
It also helps
prioritize improvement.
Not every process
deserves the same level of attention.
A process with
low capability and high customer impact should be treated as a priority.
This is where Pareto Principle
80/20 is useful. Focus
first on the few process characteristics that create the highest defect cost,
customer dissatisfaction, or operational risk.
Common Mistakes in Process
Capability Studies
Many capability
studies fail because teams calculate numbers without respecting the method.
Avoid these
mistakes:
1. Calculating Cpk on an unstable
process
If the process is
not stable, capability results may be misleading.
2. Ignoring the measurement system
Measurement error can make
the process look worse or better than reality.
3. Using too little data
Small samples may not represent real
process behavior.
4. Mixing different processes
Do not combine data from
different machines, suppliers, shifts, tools, or product families unless the
process is truly the same.
5. Ignoring non-normal distribution
Wrong assumptions can
create wrong decisions.
6. Looking only at Cp
Cp may look good while Cpk reveals poor
centering.
7. Treating Cpk as a certificate
Capability is not permanent.
It must be monitored and controlled.
8. Forgetting the business decision
The goal is not to
calculate an index. The goal is to improve customer satisfaction, reduce risk,
and protect profit.
Image 3: Capability
Interpretation Matrix
Image concept:
A 2×2 matrix: Variation low/high versus Centering good/poor. Show four
outcomes: capable, needs centering, needs variation reduction, high risk.
Caption:
Process capability depends on both variation and centering.
Alt text:
Process capability interpretation matrix showing how process variation and
centering affect Cp and Cpk results.
How to Improve Process Capability
Improving process
capability usually requires one or both of the following:
1.
Reduce variation
2.
Center the process
To reduce variation,
focus on:
·
Machine condition
·
Tooling wear
·
Material consistency
·
Operator method
·
Work instructions
·
Environmental conditions
·
Setup accuracy
·
Preventive maintenance
·
Supplier quality
·
Process parameters
·
Measurement reliability
To center the process,
focus on:
·
Target setting
·
Machine adjustment
·
Calibration
·
Standard setup procedure
·
Operator training
·
Feedback control
·
Parameter optimization
The improvement path
depends on the capability diagnosis.
If Cp is good but Cpk is
poor, center the process.
If both Cp and Cpk are
poor, reduce variation first.
If Ppk is much lower
than Cpk, investigate long-term instability.
Process Capability and Control Plan
After improving
capability, the next question is:
How do we sustain it?
A capability study
should feed into a control plan that defines:
·
Critical process
characteristics
·
Measurement method
·
Sampling frequency
·
Control chart type
·
Reaction plan
·
Responsible person
·
Escalation rules
·
Records required
·
Review frequency
Without a control
plan, the process may slowly drift back to poor performance.
Capability must be
maintained, not only achieved.
Process Capability Study
Deliverables
A professional
process capability study should include:
·
Process and characteristic
description
·
Specification limits
·
Data collection plan
·
Measurement system
validation summary
·
Sample size and data source
·
Stability analysis
·
Distribution analysis
·
Cp and Cpk results
·
Pp and Ppk results where
relevant
·
Capability histogram
·
Control chart
·
Defect risk estimate
·
Interpretation
·
Root cause findings
·
Improvement recommendations
·
Control plan
·
Management summary
This makes the study
useful for engineers, managers, auditors, suppliers, and customers.
How OpexEdge Helps Organizations
with Process Capability Studies
At OpexEdge, we
help organizations move from inspection-based quality to process-based
performance control.
Our support can
include:
·
Process capability study
design
·
Critical characteristic
selection
·
Data collection planning
·
Measurement system review
·
Gage R&R support
·
SPC and control chart setup
·
Cp, Cpk, Pp and Ppk
analysis
·
Capability dashboards
·
Root cause analysis
·
Process improvement action
plans
·
Operator and supervisor
training
·
Management reporting
·
Control plan development
·
Continuous improvement
roadmap
We combine
practical operational experience, Lean Six Sigma thinking, and data-driven
analysis to help teams understand what is really happening inside their
processes.
The goal is not
only to produce a report.
The goal is to
help the business make better decisions, reduce variation, improve customer
satisfaction, and protect profitability.
Learn more about
OpexEdge and our operational excellence approach here: About OpexEdge.
Conclusion
A process capability study is one of the most
powerful ways to connect process performance with customer requirements.
It shows whether a process can consistently
meet specifications. It reveals whether the problem is variation, centering,
stability, measurement, or unrealistic expectations.
Cp tells you the potential.
Cpk tells you the reality.
Pp and Ppk show broader performance over time.
But the real value is not in the index itself.
The real value is in the decisions that follow.
A capable process reduces defects, protects
customers, improves productivity, lowers cost, and strengthens operational
confidence.
In a competitive market, quality cannot depend
on luck or inspection alone.
Quality must be designed, measured, controlled,
and continuously improved.
A process capability study gives organizations
the evidence to do exactly that.
Call to Action
Ready to know whether your process is truly
capable?
OpexEdge can help you design and conduct a
practical process capability study supported by SPC, measurement system
analysis, and improvement actions.
Contact OpexEdge today to improve process
stability, reduce variation, and build stronger operational performance.
Website: https://opexedg.com
Email: info@opexedg.com
Email: hefnawi@opexedg.com
Mobile: +201552725900
Suggested FAQ Section
What is a process capability study?
A process capability
study is a statistical analysis used to determine whether a process can
consistently meet customer or engineering specification limits.
What is the difference between Cp
and Cpk?
Cp measures
potential capability based on process spread. Cpk measures actual capability by
considering both spread and how well the process is centered between
specification limits.
Can Cpk be higher than Cp?
Normally, Cpk is less than or
equal to Cp because Cpk considers process centering. If the process is
perfectly centered, Cp and Cpk may be very close.
What is a good Cpk value?
Many industries use 1.33 as a
common minimum target, while critical characteristics may require 1.67 or
higher. The acceptable value depends on customer requirements, industry risk,
and process criticality.
Why should the process be stable
before calculating capability?
Capability
results are only reliable when the process is stable. If special causes are
present, Cp and Cpk may not represent future process performance.
What is the difference between
Cpk and Ppk?
Cpk usually
reflects short-term capability using within-process variation. Ppk reflects
overall process performance using total variation over time.
Is process capability only for
manufacturing?
No. It can
also be used in service, logistics, warehousing, maintenance, healthcare, and
administrative processes where measurable outputs and requirements exist.
How does process capability
relate to SPC?
SPC monitors
process stability over time. Process capability evaluates whether a stable
process can meet specification limits. Both tools work together.
Do I need Gage R&R before
process capability?
For measured
characteristics, measurement system validation is strongly recommended. If the
measurement system is poor, the capability study may lead to wrong decisions.
How often should process
capability be reviewed?
Capability should
be reviewed after major process changes, new machines, new suppliers, tooling
changes, complaints, corrective actions, or whenever control charts show
meaningful process shifts.
Suggested Internal Links
Use these internal links inside the article or related
posts section:
·
SPC Statistical
Process Control
·
Control Charts
Complete Guide
·
Six Sigma Workshop
Implementation
Related TopicsTPM, Hypothesis Test , Accuracy, 6Sigma, MSA, POKAYOKE, MUDA, 5S, FMEA, SIPOC, KPI, ISO9001, ISO20022, w/h, demand planning , OTB , KANO, case study, OTB service, demand planning service , SC service, problem solving service ,
