
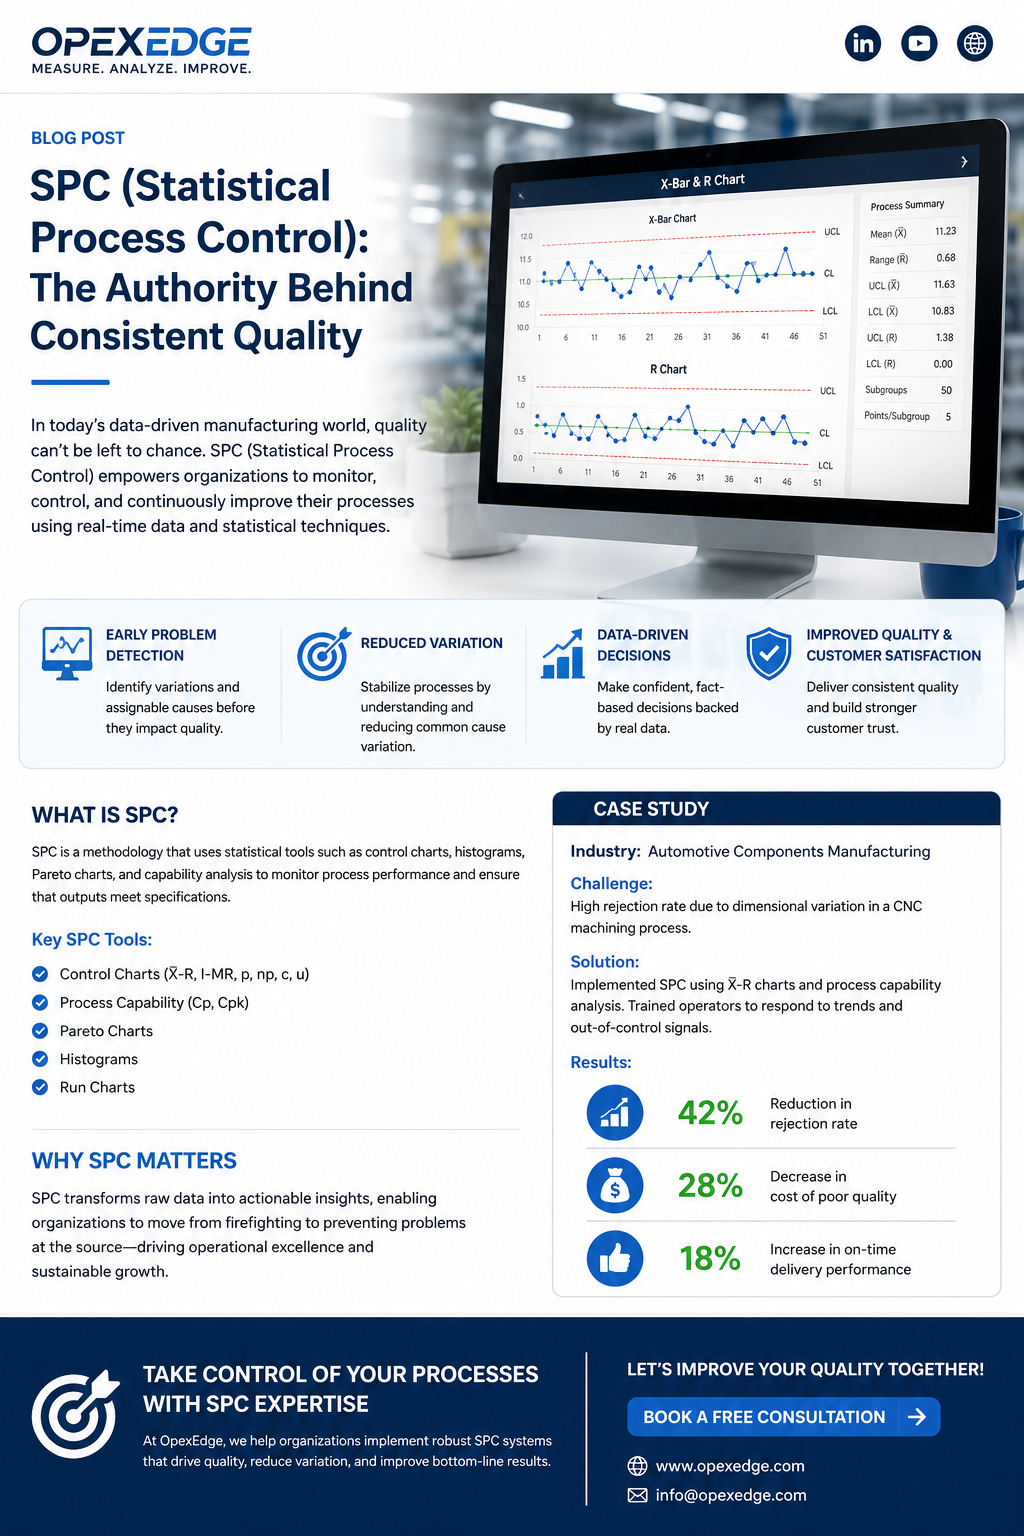
SPC Statistical Process Control: The Authority Behind Stable, Predictable, and Profitable Processes
In every operation, variation exists.
Machines vary. Materials vary. People vary. Methods vary. Environmental conditions vary. The real question is not whether variation exists, but whether the organization can understand it, control it, and improve it before it becomes waste, defects, customer complaints, or financial loss.
This is where SPC, Statistical Process Control, becomes one of the most powerful methods in operational excellence.
SPC is not only a quality tool. It is a management system for process stability. It allows organizations to monitor process behavior over time, distinguish normal variation from abnormal variation, and take action based on evidence instead of assumptions.
For manufacturers, service providers, logistics operations, laboratories, healthcare processes, and supply chains, SPC helps leaders move from reactive firefighting to proactive control.
What Is SPC?
Statistical Process Control is a data-driven method used to monitor, control, and improve a process by analyzing variation over time.
Instead of inspecting quality only after defects happen, SPC studies process performance while the process is running. It answers critical questions such as:
Is the process stable?
Is the variation normal or unusual?
Is the process capable of meeting customer requirements?
When should the team take corrective action?
When should the team avoid unnecessary adjustment?
SPC is mainly built around control charts, which plot process data in time order and compare it against statistically calculated control limits.
These limits help determine whether the process is behaving normally or whether a special cause may be affecting performance.
Why SPC Matters
Many organizations confuse inspection with control.
Inspection detects defects after they already exist. SPC helps prevent defects by identifying abnormal process behavior early.
Without SPC, teams often depend on opinions, averages, end-of-line inspection, or customer complaints. This creates a reactive culture where problems are addressed only after cost, delay, or dissatisfaction has already occurred.
With SPC, the organization can:
Reduce process variation.
Detect abnormal process behavior early.
Improve first-time-right quality.
Reduce scrap, rework, and customer complaints.
Protect process stability.
Improve decision-making with real data.
Increase confidence in process capability.
SPC is especially valuable because it helps teams avoid two common mistakes: ignoring real process signals, and overreacting to normal process noise.
Common Cause vs Special Cause Variation
SPC is built on one important principle: not all variation has the same meaning.
Common Cause Variation
Common cause variation is the natural variation built into the process. It comes from the normal combination of equipment, materials, methods, people, and environment.
When only common cause variation exists, the process is considered statistically stable, even if the result is not yet good enough.
In this case, improvement usually requires a change in the system itself.
Examples include:
Normal machine vibration.
Minor material differences.
Routine operator-to-operator variation.
Expected environmental changes.
Normal measurement variation.
Special Cause Variation
Special cause variation is unusual variation caused by a specific event or change. It indicates that something different has happened in the process.
Examples include:
Wrong machine setting.
Tool wear or breakage.
Untrained operator.
Incorrect material batch.
Maintenance issue.
Measurement system error.
Sudden change in temperature or humidity.
SPC helps separate these two types of variation so teams can respond correctly.
What Is a Control Chart?
A control chart is a graph that shows how a process changes over time.
It usually includes:
A center line representing the process average.
An upper control limit.
A lower control limit.
Time-ordered process data points.
The purpose of the chart is not only to show whether a point is high or low. The purpose is to identify whether the process is stable, predictable, and free from unusual signals.
A process can produce results within specification but still be unstable. This means defects may appear later if the special causes are not understood and eliminated.
A process can also be stable but not capable. This means the process behaves predictably, but its normal variation is too wide to meet customer requirements consistently.
That is why SPC and process capability should be used together.
SPC vs Specification Limits
One of the most important lessons in SPC is understanding the difference between control limits and specification limits.
Control Limits
Control limits are calculated from actual process behavior. They show what the process is statistically doing.
Specification Limits
Specification limits come from the customer, engineering drawing, regulation, or product requirement. They show what the process is expected to deliver.
A process may be within control limits but outside specification limits. This means the process is stable but not capable.
A process may be within specification limits but outside control limits. This means the product may look acceptable now, but the process is unstable and may create future defects.
This is why relying only on final inspection is risky.
Common SPC Tools
SPC includes several tools that support process monitoring and improvement.
1. Control Charts
Control charts are the core tool of SPC. They help identify process stability and abnormal variation.
Common types include:
X-bar and R charts.
X-bar and S charts.
I-MR charts.
p charts.
np charts.
c charts.
u charts.
2. Histograms
Histograms show the distribution of process data and help teams understand spread, centering, and shape.
3. Pareto Charts
Pareto charts help prioritize the biggest contributors to defects, downtime, complaints, or losses.
4. Run Charts
Run charts show process performance over time without control limits. They are useful as a starting point before full SPC implementation.
5. Process Capability Analysis
Capability analysis measures how well a stable process can meet specification limits. Common indicators include Cp, Cpk, Pp, and Ppk.
When Should Organizations Use SPC?
SPC should be used when a process is repeated, measurable, and important to quality, cost, delivery, safety, or customer satisfaction.
Typical applications include:
Manufacturing dimensions.
Filling weight.
Packaging defects.
Machine cycle time.
Laboratory test results.
Call center response time.
Warehouse picking accuracy.
Delivery lead time.
Supplier defect rates.
Customer complaint rates.
Equipment downtime.
SPC is not limited to factories. Any process that produces measurable outputs over time can benefit from statistical control.
How to Implement SPC
Successful SPC implementation is not about drawing charts only. It requires the right process selection, reliable data, disciplined reaction rules, and leadership commitment.
Step 1: Select the Critical Process
Start with a process that affects customer satisfaction, cost, delivery, compliance, or safety.
Good starting points include high-defect processes, unstable machines, bottlenecks, high-cost operations, and customer-critical characteristics.
Step 2: Define the Critical-to-Quality Characteristic
Choose what will be measured.
Examples include product diameter, weight, temperature, pressure, cycle time, defect count, or transaction accuracy.
The selected metric must be clearly defined and consistently measurable.
Step 3: Confirm the Measurement System
SPC depends on reliable data.
Before trusting the chart, the organization must ensure the measurement system is acceptable. This may require calibration, measurement system analysis, Gage R&R, or clear inspection standards.
Bad measurement data creates misleading control charts.
Step 4: Collect Process Data
Data should be collected in time order.
The sampling method should reflect the real process. For example, subgroup size, sampling frequency, machine condition, shift, operator, and material batch should be considered.
Step 5: Select the Right Control Chart
Different data types require different charts.
For continuous measurements, X-bar and R charts or I-MR charts are common.
For defect proportions, p charts or np charts may be used.
For defect counts, c charts or u charts may be appropriate.
Step 6: Calculate Control Limits
Control limits are calculated from process data, not from customer specifications.
The limits help define the expected range of normal process variation.
Step 7: Interpret Signals Correctly
Teams should be trained to identify out-of-control signals such as:
A point outside the control limits.
A clear trend in one direction.
A long run on one side of the center line.
Sudden shifts in the process average.
Unusual patterns or cycles.
The purpose is to detect special causes and investigate them before defects increase.
Step 8: Define a Reaction Plan
Every SPC chart should have a clear reaction plan.
When a signal appears, the team should know what to check, who should respond, how to contain risk, and how to document the cause and action.
Without a reaction plan, SPC becomes only a reporting activity.
Step 9: Improve the Process
Once the process is stable, capability can be assessed.
If the process is stable but not capable, improvement projects may be needed to reduce variation, center the process, improve equipment, standardize methods, or redesign the process.
Step 10: Sustain and Review
SPC should be reviewed regularly by operators, supervisors, quality engineers, and management.
The objective is not only to control the process, but to build a culture of data-based problem solving.
SPC Case Study: Reducing Dimensional Variation in CNC Manufacturing
Business Context
An automotive components manufacturer was facing recurring dimensional defects in a CNC machining process.
The part was customer-critical, and even small dimensional variation caused assembly issues, rework, sorting, and delayed shipments.
The company was relying heavily on final inspection. Defects were being detected late, after value had already been added to the product.
Challenge
The main problems were:
High rejection rate due to dimensional variation.
Frequent machine adjustments based on operator judgment.
Lack of visibility into process stability.
Inconsistent reaction to abnormal readings.
Increasing cost of poor quality.
The process had specification limits, but the team was not using control charts to understand whether the process was stable or drifting.
SPC Approach
The improvement team selected the critical dimension and started collecting time-ordered measurement data.
An X-bar and R chart was introduced because the process used subgroup measurements at regular intervals.
The team also reviewed the measurement system to confirm that inspection variation was not creating false signals.
Operators were trained to understand the difference between normal variation and abnormal process signals.
A reaction plan was created for out-of-control conditions.
The plan included checking tool wear, fixture condition, machine offset, coolant condition, material batch, and operator setup method.
Key Actions
The team implemented:
SPC control charts at the machine level.
Standard sampling frequency.
Clear control chart reaction rules.
Operator training on process signals.
Tool-life monitoring.
Setup standardization.
Daily review of control chart performance.
Root cause analysis for abnormal points.
Process capability review after stabilization.
Results
After SPC implementation, the organization achieved:
42% reduction in rejection rate.
28% reduction in cost of poor quality.
18% improvement in on-time delivery performance.
Better operator response to abnormal process behavior.
Less unnecessary machine adjustment.
Improved confidence in process stability.
The most important result was cultural. The team stopped reacting to every small movement in the data and started responding only to meaningful process signals.
This improved both quality and productivity.
Common SPC Mistakes
Many SPC programs fail because organizations treat the chart as a form instead of a management tool.
Common mistakes include:
Using SPC only for customer audits.
Creating charts without reaction plans.
Confusing control limits with specification limits.
Collecting data without checking measurement reliability.
Ignoring operator training.
Adjusting the process too frequently.
Using the wrong chart type.
Failing to investigate special causes.
Not linking SPC to improvement projects.
SPC works when it becomes part of daily process management, not when it is used only as documentation.
SPC and Operational Excellence
SPC supports Lean, Six Sigma, ISO 9001, TPM, and continuous improvement programs.
In Lean, SPC helps reduce variation and prevent waste.
In Six Sigma, SPC supports control phase activities and process capability improvement.
In ISO 9001, SPC supports evidence-based decision-making, process monitoring, and continual improvement.
In TPM, SPC can help monitor equipment-related process variation and detect early deterioration.
In supply chain and service operations, SPC helps monitor lead time, accuracy, reliability, and performance consistency.
SPC is one of the strongest bridges between quality management and operational excellence.
Benefits of SPC
Organizations that apply SPC effectively can achieve significant benefits, including:
Lower defect rates.
Lower rework and scrap cost.
More stable production output.
Faster detection of process changes.
Better customer satisfaction.
Improved process capability.
Stronger supplier performance control.
More disciplined problem solving.
Better communication between operations and quality teams.
Improved audit readiness.
SPC does not replace leadership, training, maintenance, or process improvement. It makes them more focused and evidence-based.
How OpexEdge Helps Organizations Implement SPC
At OpexEdge, we help organizations move from reactive quality control to proactive process control.
Our SPC support can include:
Process selection and critical parameter identification.
SPC implementation roadmap.
Control chart selection.
Data collection plan.
Measurement system review.
Operator and supervisor training.
SPC templates and dashboards.
Reaction plan development.
Root cause analysis support.
Process capability analysis.
Continuous improvement action plan.
Management review reporting.
The goal is not only to create charts. The goal is to build a practical process-control system that improves quality, reduces cost, and strengthens operational performance.
Conclusion
SPC Statistical Process Control is one of the most effective ways to understand, control, and improve process performance.
It helps organizations distinguish between normal variation and real process problems. It prevents overreaction, supports early detection, improves process capability, and creates a stronger foundation for operational excellence.
In a competitive market, quality cannot depend on inspection alone.
Quality must be built into the process, monitored with real data, and improved continuously.
SPC gives organizations the discipline, visibility, and confidence to do exactly that.
Call to Action
Ready to take control of your process variation?
OpexEdge can help you design and implement a practical SPC system that improves quality, reduces waste, and delivers measurable business results.
Contact OpexEdge today to start your SPC implementation journey.
Website: www.opexedg.com
Email: info@opexedg.com
Email: hefnawi@opexedg.com
Mobile: +201552725900
Suggested FAQ Section
What does SPC stand for?
SPC stands for Statistical Process Control. It is a method used to monitor and control process performance using statistical tools and time-ordered data.
What is the main purpose of SPC?
The main purpose of SPC is to detect abnormal process variation early and support data-based decisions before defects or failures increase.
What is the most common SPC tool?
The most common SPC tool is the control chart. It helps monitor process behavior over time and identify potential special-cause variation.
What is the difference between control limits and specification limits?
Control limits are calculated from actual process data. Specification limits are defined by customer, engineering, or regulatory requirements.
Can SPC be used outside manufacturing?
Yes. SPC can be used in services, logistics, healthcare, laboratories, call centers, warehouses, and any process that produces measurable data over time.
Related TopicsTPM, Hypothesis Test , Accuracy, 6Sigma, MSA, POKAYOKE, MUDA, 5S, FMEA, SIPOC, KPI, ISO9001, ISO20022, w/h, demand planning , OTB , KANO, case study, OTB service, demand planning service , SC service, problem solving service ,

3 Comments